Author: Lisa

Firewalld — Adding and Removing a Forwarding Rule

(Sorry, Anya … after today, I’ll try to not post anything about computers for three days!) Linux restricts non-root users from opening ports <1024. It’s generally a good idea not to run your services as root. Which means, unfortunately, we end up running a lot of services on nonstandard ports (so frequently that 1389 and 1636 are a quasi-standard port for LDAP and LDAPS, 8080 and 8443 quasi-standard ports for HTTP and HTTPS). But having to remember to add the nonstandard port to a web URL is an annoyance for users — I’ve seen a lot of people fix this by adding a load balanced VIP or NGINX proxy in front of the service to handle port translations. But there is a quick and easy way to handle port translation without any additional equipment. Most Linux hosts have firewalld running, and you can tell the firewall to forward the port for you. In this example, I’m letting my Kibana users access my web service using https://kibana.example.com without needing to append the :5601:

firewall-cmd –permanent –zone=public –add-forward-port=port=443:proto=tcp:toport=5601

Should you decide against the port forwarding, the same command with –remove-forward-port deregisters the rule:
firewall-cmd –zone=public –remove-forward-port=port=443:proto=tcp:toport=5601

ElastAlert2 SSL with OpenSearch 2.x

This turned out to be one of those situations where I went down a very complicated path for a very simple problem. We were setting up ElastAlert2 in our OpenSearch sandbox. I’ve used both the elasticsearch-py and opensearch-py modules with Python 3 to communicate with the cluster, so I didn’t anticipate any problems.

Which, of course, meant we had problems. A very cryptic message:

javax.net.ssl.SSLHandshakeException: Insufficient buffer remaining for AEAD cipher fragment (2). Needs to be more than tag size

A quick perusal of the archive of all IT knowledge (aka Google) led me to a Java bug: https://bugs.openjdk.org/browse/JDK-8221218 which may or may not be resolved in the latest OpenJDK (which we are using). I say may or may not because it’s marked as resolved in some places but people report experiencing the bug after resolution was reported.

Fortunately, the OpenSearch server reported something more useful:

[2022-09-20T12:18:55,869][WARN ][o.o.h.AbstractHttpServerTransport] [UOS-OpenSearch.example.net] caught exception while handling client http traffic, closing connection Netty4HttpChannel{localAddress=/10.1.2.3:9200, remoteAddress=/10.1.2.4:55494}
io.netty.handler.codec.DecoderException: io.netty.handler.ssl.NotSslRecordException: not an SSL/TLS record: 504f5354202f656c617374616c6572745f7374617475735f6572726f722f5f646f6320485454502f312e310d0a486f73743a20

Which I’ve shortened because it was several thousand fairly random seeming characters. Except they aren’t random — that’s the communication hex encoded. Throwing the string into a hex decoder, I see the HTTP POST request.

Which … struck me as rather odd because it should be SSL encrypted rubbish. Turns out use_ssl was set to False! Evidently attempting to send clear text ‘stuff’ to an encrypted endpoint produces the same error as reported in the Java bug.

Setting use_ssl to true brought us to another adventure — an SSLCertVerificationError. We have set the verify_certs to false — even going so far as to go into util.py and modifying line 354 so the default is False. No luck. But there’s another config in each ElastAlert2 rule — http_post_ignore_ssl_errors — that actually does ignore certificate errors. One the rules were configured with http_post_ignore_ssl_errors, ElastAlert2 was able to communicate with the OpenSearch cluster and watch for triggering events.

OpenSearch 2.x: Building a New Tenant

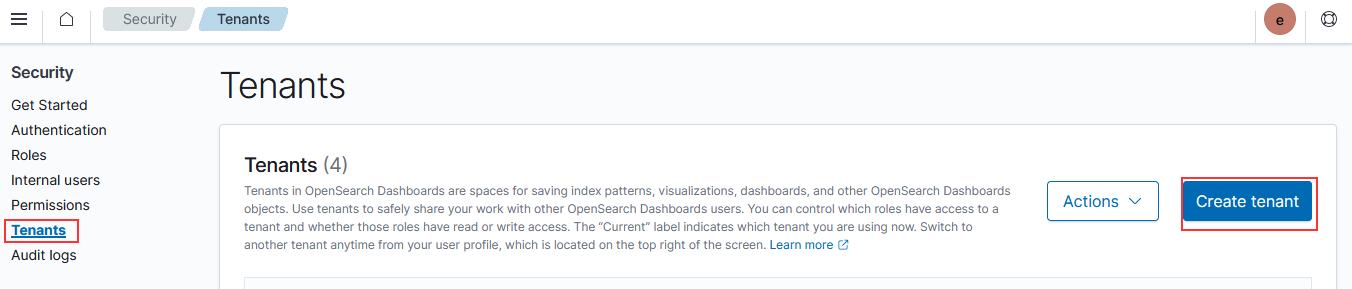
Logged in as an admin user, use the left-hand navigation menu to select “Security”. Select “Tenants” and click on “Create tenant”.

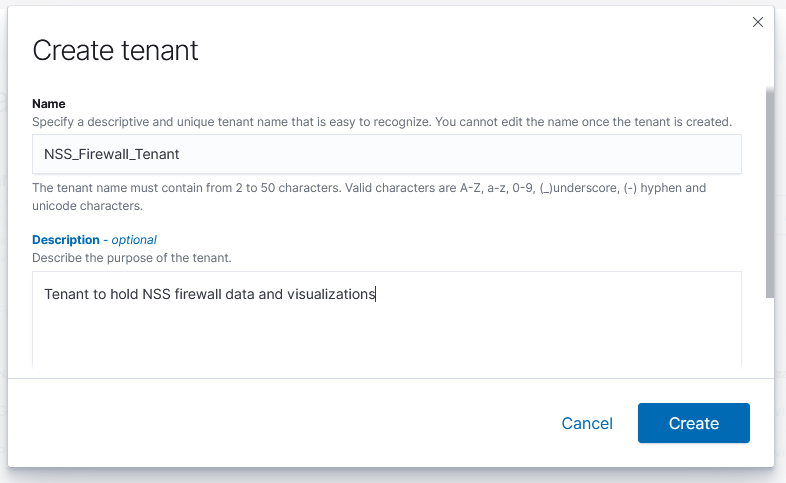
Give the tenant a name and a description, then click “Create”

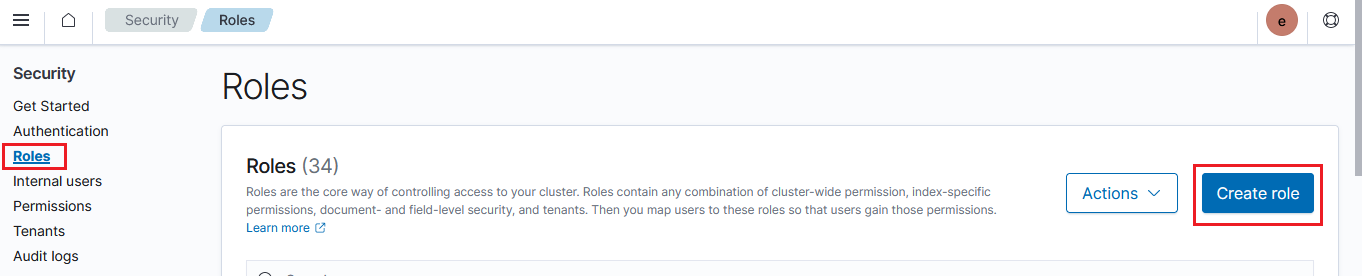
OK, now a tenant is created. The important bit is to establish a role that only sees data within the tenant. Click on “Roles”, then click “Create role”.

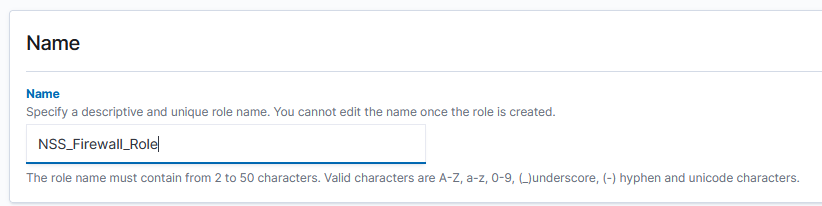
Give the role a name:

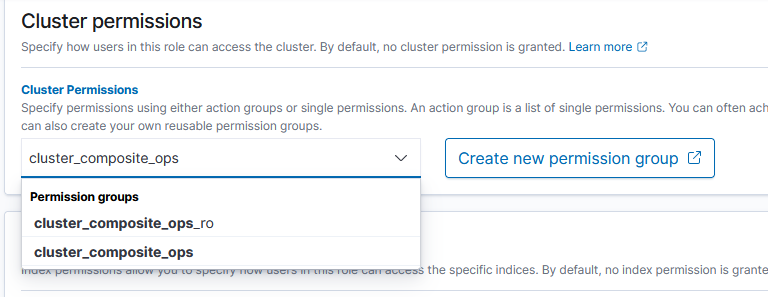
Under “Cluster permissions” add either cluster_composite_ops_ro (for read only access – cannot make new visualizations or dashboards) or cluster_composite_ops – we may make a “help desk” type role where users are not permitted to write to the tenant, but my examples herein are all for business owners who will be able to save queries, create visualizations, modify dashboards, etc.

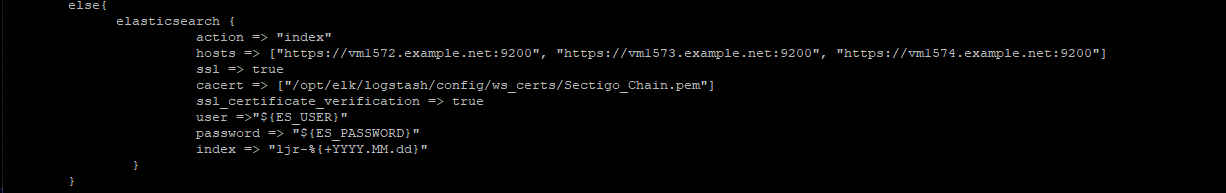
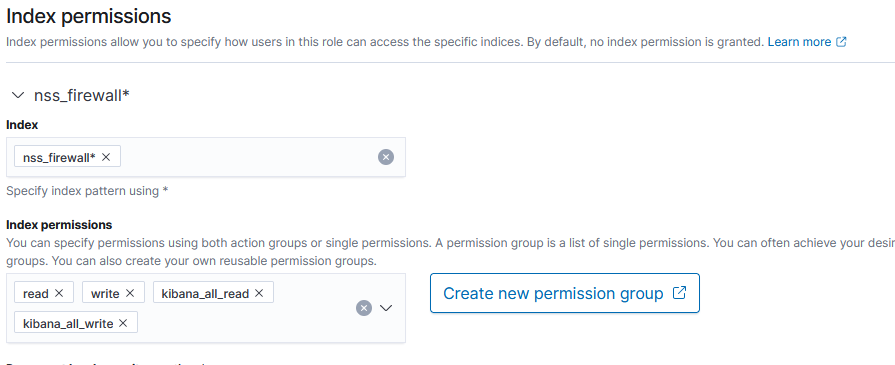
Under “Index permissions”, add the index pattern (or patterns) to which the tenant should have access. Add read or read/write permissions to the index. We are not using any of the fine-grained security components (providing access only to records that come in from a specific host or contain a specific error)

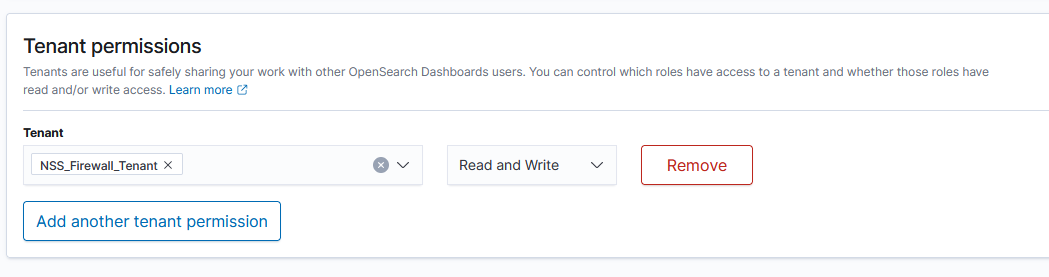
Finally, under “Tenant Permissions”, select the associated tenant and grant either Read or Read and Write permission

Click “Create” and your new role has been created. Once created, click on “Mapped users”

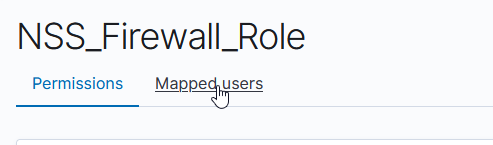
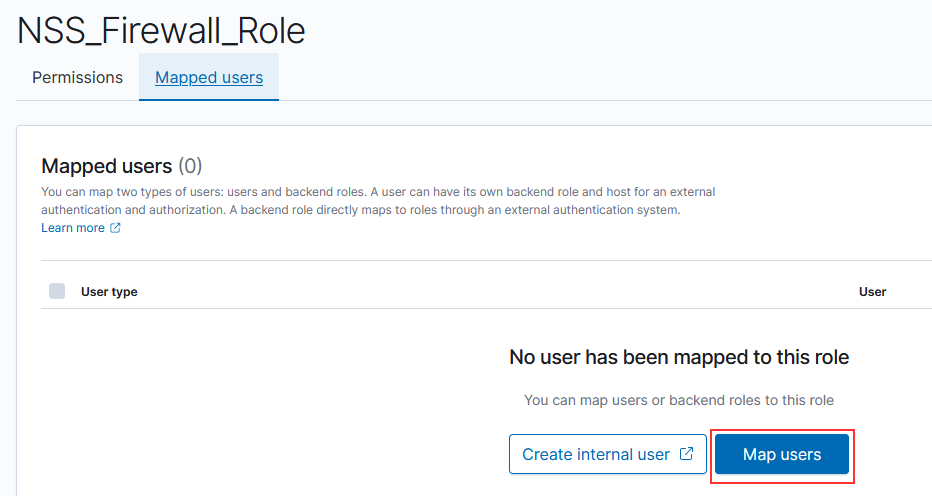
Select “Map users” to edit the users mapped to the role.

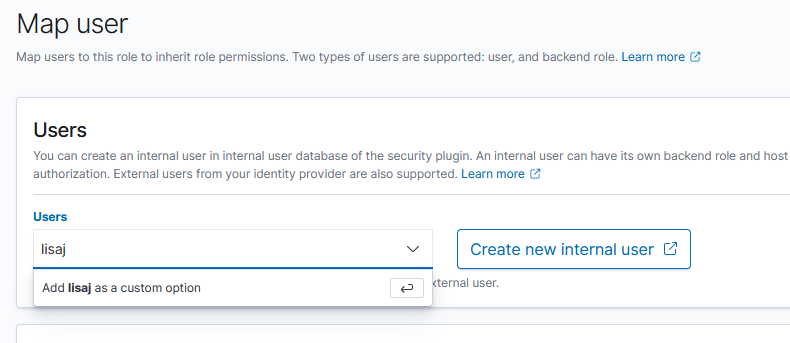
To map an externally authenticated user (accounts authenticate through OpenID, for example), just type the username and hit enter to add “as a custom option”.

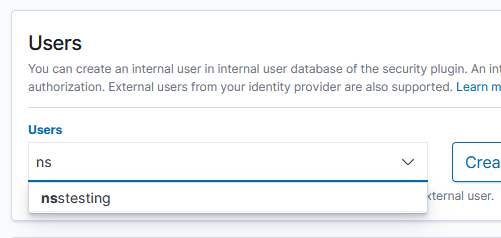
For an internal user, you’ll be able to select them from a user list as you begin typing the user ID

There is one trick to getting a new tenant working — https://forum.opensearch.org/t/multi-tenancy-for-different-indices/5008/8 indicates you’ve got to use an admin account from the global tenant, switch to the new tenant, and create the index pattern there. Once the index pattern (or, I suppose, patterns) has been created, the tenant users are able to discover / visualize their data.

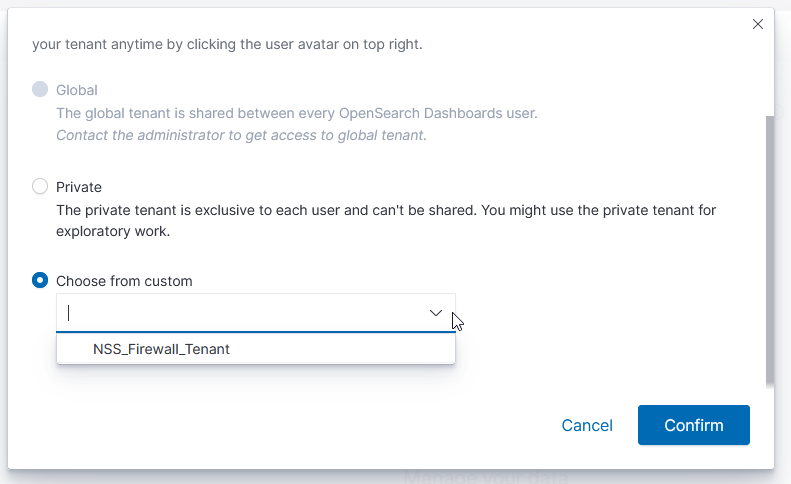
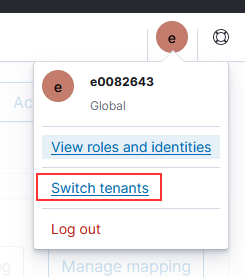
Click on the icon for your user account and select “Switch tenants”

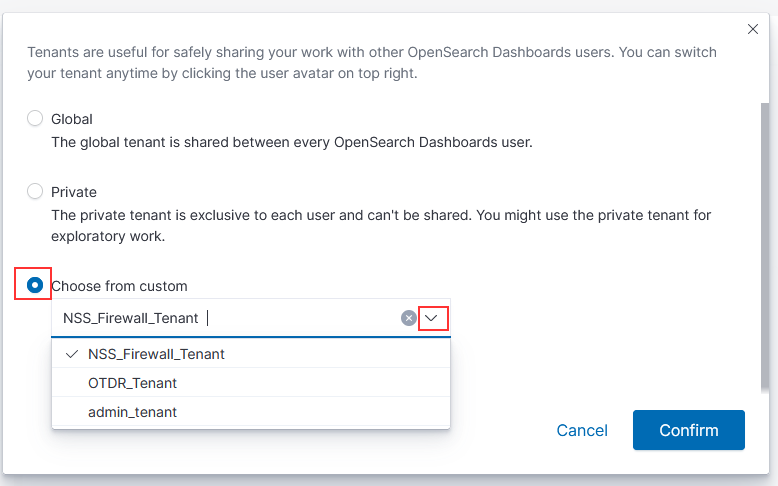
Select the radio button in front of “Choose from custom” and then use the drop-down to select your newly created tenant. Click “Confirm” to switch to that tenant.

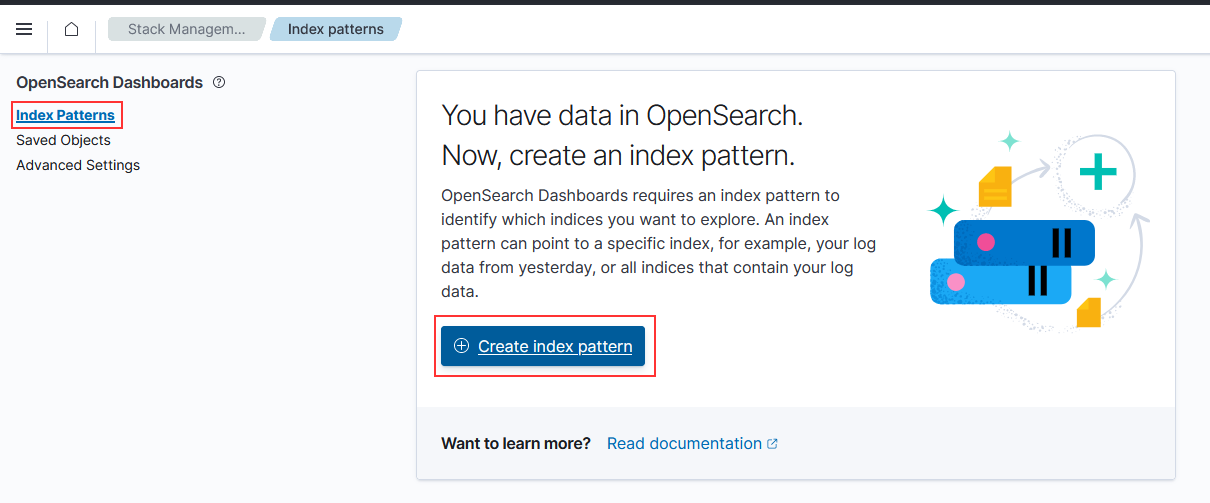
From the left-hand navigation menu, select “Stack Management” and then select “Index Patterns”. Click to “Create index pattern”

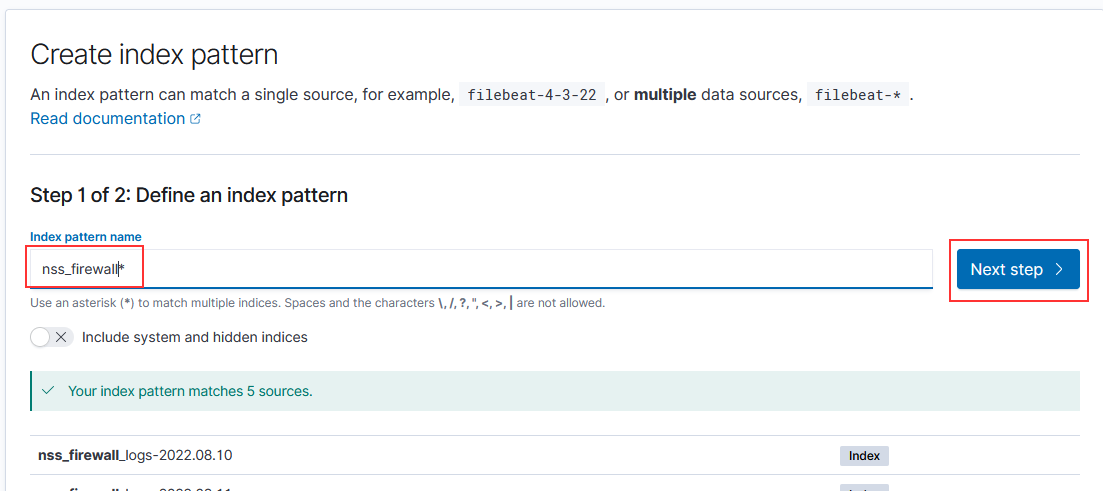
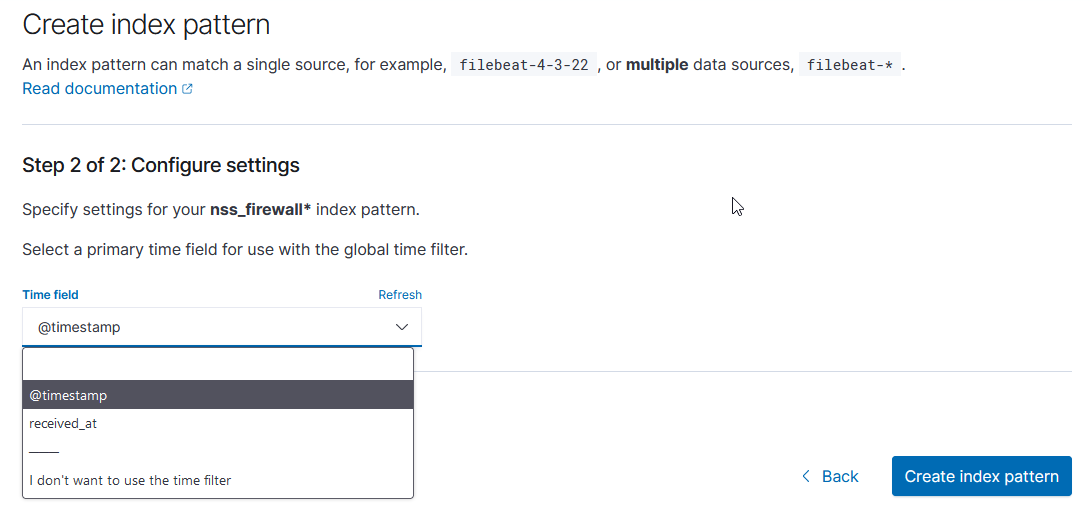
Type the pattern and click “Next step”

Select the time field from the drop-down menu, then click “Create index pattern”

Now you’re ready – have a user log into OpenSearch Dashboard. They’ll need to select the radio button to “Choose from custom” and select their tenant from the dropdown menu.


Logstash – Filtering Null-Terminated Messages

I have a syslog message that contains a null terminated string: "syslog_message":"A10\u0000" — these messages represent is-alive checks from a load balancer to the logstash servers. I would prefer not to have thousands of “the A10 checked & said logstash is still there” filling up Elasticsearch.

Unfortunately, the logstash configuration doesn’t recognize unicode escape sequences … and it’s not like I can literally type a NULL the way I could type a ° or è

I’ve been able to filter out any messages that start with A10. Since our “real” messages start with timestamps, I shouldn’t be dropping any good data, but there’s always the possibility. Without any way to indicate a null character, the closest match is any single character … and I’ve decided not to worry about a possible log message that is simply A101 or A10$ until we encounter a system that would send such messages.

#if [message] == "A10\u0000"{  -- doesn't work
#if [message] == "A10\\u0000"{ -- doesn't work
#if [message] == 'A10\u0000'{  -- doesn't work
#if [message] =~ /^A10/{       -- this isn't great because of false positives, although *these* messages all start with a timestamp so are unlikely to match
if [message] =~ "^A10.$" {
     drop { }
}


Outlook Preferred Meeting Time

While this doesn’t address work days or conveniently highlight working and non-working hours when someone is checking free/busy … Microsoft does offer a way for individuals to publish their preferred working hours – so someone who lives in Mountain time but works 6AM-3PM to match their colleagues on the east coast can let us all know that they are keeping non-standard hours for their time zone.

Logged in to OWA, select the “Settings” gear:

Select “Calendar” and then select “View” – there is a place to specify your “meeting hours”.

That data is used to populate “Preferred meeting hours” in your profile card:


Using the Dell 1350CN On Fedora

We picked up a really nice color laser printer — a Dell 1350CN. It was really easy to add it to my Windows computer — download driver, install, voila there’s a printer. We found instructions for using a Xerox Phaser 6000 driver. It worked perfectly on Scott’s old laptop, but we weren’t able to install the RPM on his new laptop — it insisted that a dependency wasn’t found: libstdc++.so.6 CXXABI_1.3.1

Except, checking the file, CXXABI_1.3.1 is absolutely in there:

2022-09-17 13:04:19 [lisa@fc36 ~/]# strings /usr/lib64/libstdc++.so.6 | grep CXXABI
CXXABI_1.3
CXXABI_1.3.1
CXXABI_1.3.2
CXXABI_1.3.3
CXXABI_1.3.4
CXXABI_1.3.5
CXXABI_1.3.6
CXXABI_1.3.7
CXXABI_1.3.8
CXXABI_1.3.9
CXXABI_1.3.10
CXXABI_1.3.11
CXXABI_1.3.12
CXXABI_1.3.13
CXXABI_TM_1
CXXABI_FLOAT128

We’ve tried using the foo2hbpl package with the Dell 1355 driver to no avail. It would install, but we weren’t able to print. So we returned to the Xerox package.

Turns out the driver package we were trying to use is a 32-bit driver (even though the download says 32 and 64 bit). From a 32-bit perspective, we really didn’t have libstdc++ — a quick dnf install libstdc++.i686 installed the library along with some friends.

Xerox’s rpm installed without error … but, attempting to print, just yielded an error saying that the filter failed. I had Scott use ldd to test one of the filters (any of the files within /usr/lib/cups/filter/Xerox_Phaser_6000_6010/ — it indicated the “libcups.so.2” could not be found. We also needed to install the 32-bit cups-libs.i686 package. Finally, he’s able to print from Fedora 36 to the Dell 1350cn!


Filebeat – No Harvesters Starting

Using filebeat-7.17.4, we have seen instances where no harvesters will start and no IP communication is established with the logstash servers. Stopping the filebeat service, confirming the process and any associated network ports are closed, and then starting the service does not restore communication. In this situation, we have had to restart the ​logstash​ servers and immediately begin to see harvesters spin up in the log files:

2022-09-15T12:02:20.018-0400    INFO    [input.harvester]       log/harvester.go:309    Harvester started for paths: 
[/var/log/network/network.log /opt/splunk/var/log/syslog-ng/*/*.log]       
{"input_id": "bf04e307-7fb3-5555-87d5-55555d3fa8d6", "source": "/var/log/syslog-ng/mr01.example.net/network.log",
 "state_id": "native::2228458-65570", "finished": false, "os_id": "2225548-64550", "old_source": 
"/var/log/syslog-ng/mr01.example.net/network.log", "old_finished": true, "old_os_id": "2225548-64550", 
"harvester_id": "36555c83-455c-4551-9f55-dd5555552771"}

Logstash – Setting Config with Environment Variables

I took over management of an ElasticSearch environment that has a lot of configuration inconsistencies. Unfortunately, the previous owners weren’t the ones who built the environment either … so no one knew why ServerX did one thing and ServerY did another. Didn’t mess with it (if it’s working, don’t break it!) until we encountered some users who couldn’t find their data — because, depending on which logstash server information transits, stuff ends up in different indices. So now we’re consolidating configurations and I am going to pull the “right” config files into a git repo so we can easily maintain consistency.

Except … any repository becomes in scope for security scanning. And, really, typing your password in clear text isn’t a wonderful plan. So my first step is using environment variables as configuration parameters in logstash.

The first thing to do is set the environment variables somewhere logstash can use them. In my case, I’m using a unit file that sources its environment from /etc/default/logstash

Once the environment variables are there, enclose the variable name in ${} and use it in the config:

Logstash Config

Restart ElasticSearch and verify the pipeline(s) have started successfully.

Finding PCI Devices

You can use dmidecode to list all sorts of information about the system — there is a list of device types that you can use with the “-t” option

   Type   Information
   ────────────────────────────────────────────
      0   BIOS
      1   System
      2   Baseboard
      3   Chassis
      4   Processor
      5   Memory Controller
      6   Memory Module
      7   Cache
      8   Port Connector
      9   System Slots
     10   On Board Devices
     11   OEM Strings
     12   System Configuration Options
     13   BIOS Language
     14   Group Associations
     15   System Event Log
     16   Physical Memory Array
     17   Memory Device
     18   32-bit Memory Error
     19   Memory Array Mapped Address
     20   Memory Device Mapped Address
     21   Built-in Pointing Device
     22   Portable Battery
     23   System Reset
     24   Hardware Security
     25   System Power Controls
     26   Voltage Probe
     27   Cooling Device
     28   Temperature Probe
     29   Electrical Current Probe
     30   Out-of-band Remote Access
     31   Boot Integrity Services
     32   System Boot
     33   64-bit Memory Error
     34   Management Device
     35   Management Device Component
     36   Management Device Threshold Data
     37   Memory Channel
     38   IPMI Device
     39   Power Supply
     40   Additional Information
     41   Onboard Devices Extended Information
     42   Management Controller Host Interface

Blah

[lisa@fedora ~/]# dmidecode -t 9

Handle 0x0024, DMI type 9, 17 bytes
System Slot Information
Designation: Slot6
Type: 32-bit PCI
Current Usage: In Use
Length: Short
ID: 6
Characteristics:
3.3 V is provided
Opening is shared
PME signal is supported
Bus Address: 0000:0a:02.0

The “Bus Address” value corresponds to information from lspci:

[lisa@fedora ~/]# lspci | grep “0a:02.0”
0a:02.0 Multimedia video controller: Conexant Systems, Inc. CX23418 Single-Chip MPEG-2 Encoder with Integrated Analog Video/Broadcast Audio Decoder