Contents
Using Git Submodules
What Are Submodules?
Before You Start
Recursion
Adding Submodules
Performing Operations on All Submodules
Cloning a Repository That Contains Submodules
Making Changes to a Submodule
Pulling Changes Made to Submodules
Including Submodules in ADO Pipelines
Git Submodule Quick Reference Guide
What Are Submodules?
A submodule is a link – it is a pointer at a specific path in the parent repository’s directory structure that references a specific commit in another git repository. The actual git repository is no different than any other repository – what makes it a ‘submodule’ is someone using it inside a parent repository. If I create a really cool PHP function – an Excel parsing utility – I can publish it to a git repository to share it. This repository is not a submodule for me. Someone who wants to use my utility may add my repository as a submodule in their code repo. In their repo, my repository that houses the Excel parsing utility is a submodule. You cannot tell, by looking at a repository, if it is included elsewhere as a submodule.
The example provided above – one individual looking to include someone else’s code in their project – is the typical use case for submodules. But there are other scenarios where isolating different parts of code make sense. In our organization, we cannot deploy code until it passes a security scan. This means problems in one section of the code can hold up development on everything else. Additionally, our code scanning is charged per repository. While we may have a dozen independent tools that happen to reside in a parent folder, it is not cost effective to have dozens of repositories being scanned. Using submodules will allow us to roll up independent tools into a single scanned repository.
The parent repository does not actually track the changes in a submodule. Instead, the parent contains a pointer to a commit identifier in the submodule repository. All changes in the submodule are tracked in its repository.
Before You Start
Before working with submodules, ensure you have an up to date version of git. If, as you interact with remote repositories, you see an error indicating you are using an older version of git:

You are apt to see fatal errors like this:

Recursion
You can have submodules inside of submodules inside of submodules – because of this, most command that interact with submodules have a –recursive flag that will recursively apply the command to any submodules contained within submodules within the parent repository.
Adding Submodules
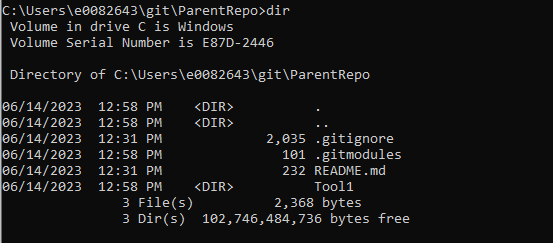
Begin with a git repository that will serve as the parent – in this example, I am starting with a blank repo that only contains a .gitignore and a readme.md file, but you can start with a repository that’s been under development for years.

We link in submodules using “git submodule add” followed by the repo URL. If you want the folder to have a different name, use “git submodule add URLHERE folderNameForSubmodule”

Once the Tool1 submodule has been added, files from Tool1 are on disk.

Check out a branch in the submodule, or use “git submodule foreach” to check each submodule out to the desired branch (main in this case)

If you use git diff with the –submodule switch, you can see that “Tool1” is being tracked as a submodule.

Add and commit the change – since this is both an entry in the .gitmodules file and the submodule reference to a commit hash, I am using “git add *”

Then push the changes to ADO

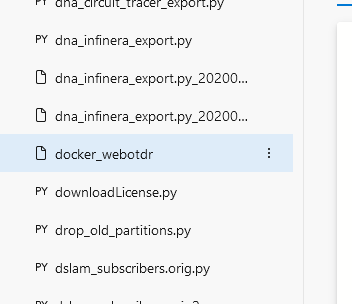
Looking in ADO, you will see each submodule folder is represented as a file. The file contents is the hash of the commit to which the submodule points.

Because the “folder” is reflected as a file in the repository, it will not sort with the other folders. You’ll need to look in the file listing to find the submodule file.

Performing Operations on All Submodules
The “git submodule foreach” command allows you to run commands on each submodule in a repository.
You can run any git command in this fromeach loop – as an example, I will checkout a specific branch in all submodules using
git submodule foreach –recursive git checkout main

Cloning a Repository That Contains Submodules
Cloning with –recurse-submodules flag
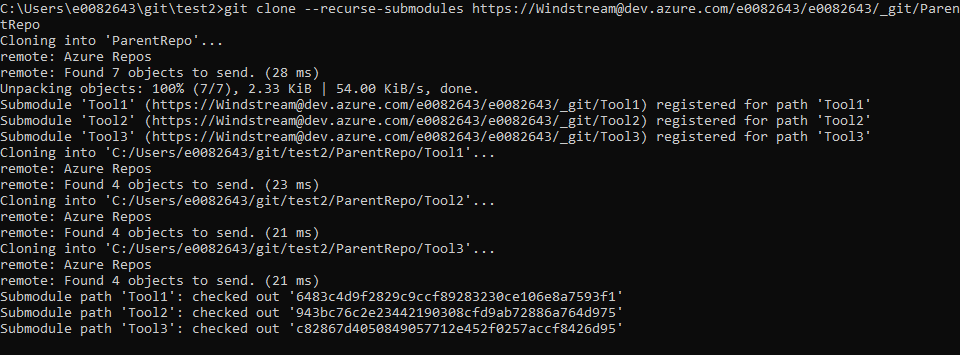
When cloning a repository with submodules, add –recurse-submodules to your git clone command to pull all of the submodules. To clone my ParentRepo, I use:
git clone –recurse-submodules https://Windstream@dev.azure.com/e0082643/e0082643/_git/ParentRepo
You will see that git checks out the parent project and all included submodules.

Use “git submodule foreach –recursive git checkout main” to check each submodule out to the desired branch (in this case, main).

Cloning without –recurse-submodules
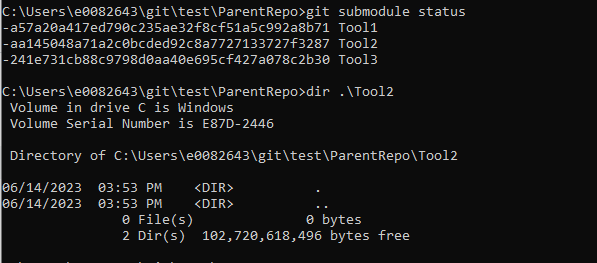
If you forget to include –recurse-submodules in your clone command, or if the submodules have been added to a repository that you have already cloned, you will have empty folders instead of each submodule’s files. A parent repository only has pointers to commits for submodules – until the submodules are initialized, those pointers go nowhere.

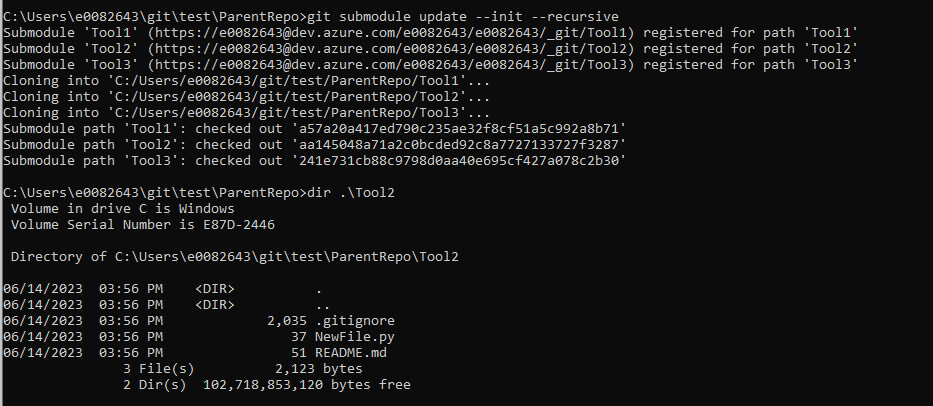
Use git submodule update –init –recursive to pull files from the registered submodules.

Making Changes to a Submodule
Working within a submodule’s folder will perform operations in the submodule’s git repository. Working in other folders will perform operations in the parent’s git repository.
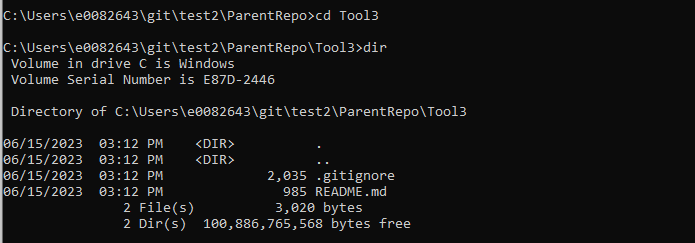
To make a change to Tool3, I first need to change into the Tool3 directory.

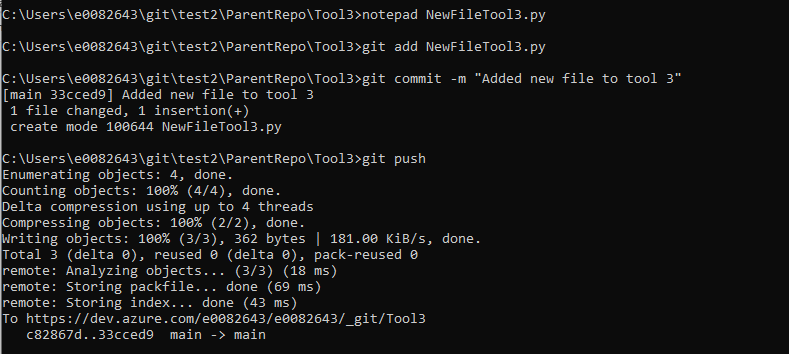
Make whatever changes are needed. Then add the changes, create a commit, and push the commit to the submodule’s repository. You can create branches, merge branches, and such all within the submodule’s folder to interact with the submodule’s git repository.

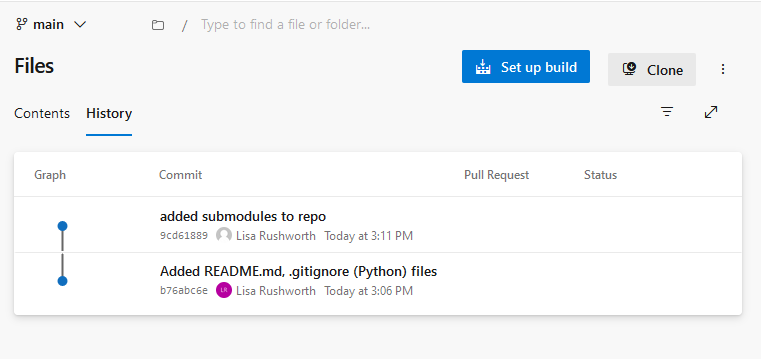
If you look at the parent repository, you will see that no changes have been made to it – committing changes to a submodule repository will not kick off the pipeline code scan.

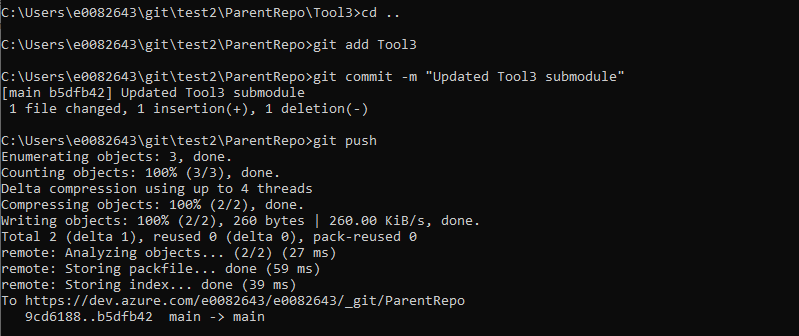
To update the parent repository to point the submodule to your most recent commit, you will need to commit the submodule folder in the parent folder. Change directory into the parent repo – add, commit, and push the changes.

And push the references to the remote using “git submodule update –recursive –remote”

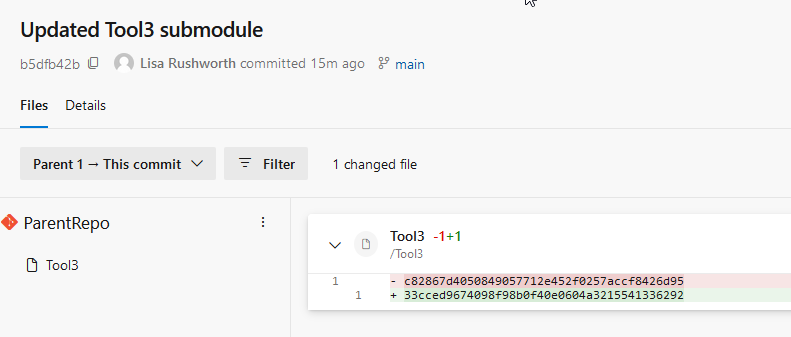
This commit updates the contents of the file representing the repo’s folder – the folder’s file used to reference a commit ending in 6d95 and now it references a commit ending in 6292

Which you can see in the git log of the submodule repository:

Because we have made changes to the parent repository, the pipeline that initiates our code scanning should execute.
Pulling Changes Made to Submodules
To sync changes made by others (or that you’ve made in other locations), you will need to pull the submodules, you need to pull the submodule as well as the parent repo.
To pull (fetch and merge) changes from all upstream submodules, use:
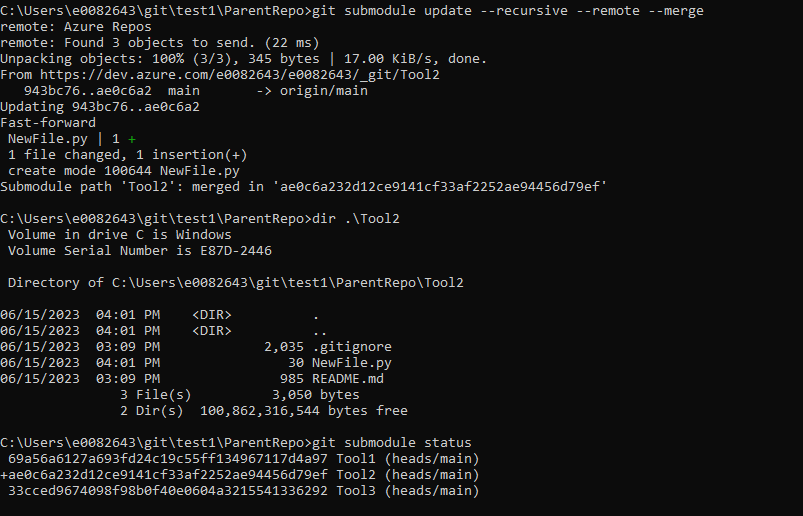
git submodule update –recursive –remote –merge

Using “git submodule status” to view the submodules, you can see the submodule now points to the commit hash from the change we made
Including Submodules in ADO Pipelines
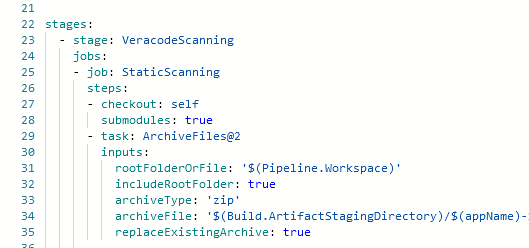
Veracode scanning is initiated through a pipeline. Since our goal is to include files from all of the submodules when scanning the parent repository, we need to ensure those files get bundled into the zip file that is submitted for scanning.
To do so, we need to add a checkout step to the pipeline and set “submodules” to ‘true’

When the submodules are all part of the same ADO project, you do not need to supply additional credentials in the pipeline. Where a different set of credentials are required, you can check out the submodule by passing an extra header with an authorization token.
Git Submodule Quick Reference Guide
Clone repo and all submodules:
git clone –recurse-submodules REPO_URL
cd RepoFolder
git submodule update –init –recursive
git submodule foreach –recursive git checkout main
Add a submodule to a repo:
git submodule add REPO_URL /path/to/folderForSubmodule
git submodule update –init –recursive
git submodule foreach –recursive git checkout main
git add .
git commit -m “Adding submodules”
git push
git submodule update –recursive –remote
Check Out a Branch in All Submodules
git submodule foreach –recursive git checkout main
Committing Change to a Submodule
cd .\submodule_folder
# Make some changes!
git add .
git commit –author=”Lisa Rushworth <Lisa.Rushworth@windstream.com>” -m “Commit Message”
git push
cd ..
git add submodule_folder
git commit -m “Updated submodule”
git push
Pull Updates into All Submodules:
git submodule update –recursive –remote –merge

