Before sending data, you need a pipleline on logstash to accept the data. If you are using an existing pipeline, you just need the proper host and port for the pipeline to use in the Filebeat configuration. If you need a new pipeline, the input needs to be of type ‘beats’
- If you want to parse the log data out into fields, use a grok filter. Grok parser rules can be tested at https://www.javainuse.com/grok
# Sample Pipeline Config:
input {
beats {
host => "logstashserver.example.com"
port => 5057
client_inactivity_timeout => "3000"
}
}
filter {
grok{
match => {"message"=>"\[%{TIMESTAMP_ISO8601:timestamp}] %{DATA:LOGLEVEL} \[Log partition\=%{DATA:LOGPARTITION}, dir\=%{DATA:KAFKADIR}\] %{DATA:MESSAGE} \(%{DATA:LOGSOURCE}\)"}
}
}
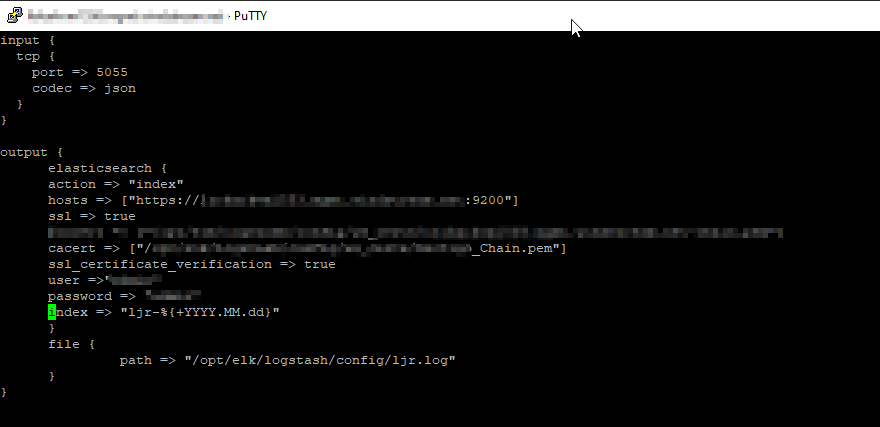
output {
elasticsearch {
action => "index"
hosts => ["https://eshost.example.com:9200"]
ssl => true
cacert => ["/path/to/certs/CA_Chain.pem"]
ssl_certificate_verification => true
user =>"us3r1d"
password => "p@s5w0rd"
index => "ljrkafka-%{+YYYY.MM.dd}"
}
}
Download the appropriate version from https://www.elastic.co/downloads/past-releases#filebeat – I am currently using 7.17.4 as we have a few CentOS + servers.
Install the package (rpm -ihv filebeat-7.17.4-x86_64.rpm) – the installation package places the configuration files in /etc/filebeat and the binaries and other “stuff” in /usr/share/filebeat
Edit /etc/filebeat/filebeat.yml
-
- Add inputs for log paths you want to monitor (this may be done under the module config if using a module config instead)
- Add an output for Logstash to the appropriate port for your pipeline:
output.logstash:
hosts: [“logstashhost.example.com:5055”]
Run filebeat in debug mode from the command line and watch for success or failure.
filebeat -e -c /etc/filebeat/filebeat.yml -d "*"
Assuming everything is running well, use systemctl start filebeat to run the service and systemctl enable filebeat to set it to launch on boot.
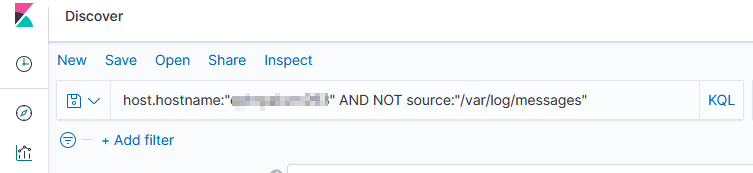
Filebeats will attempt to parse the log data and send a JSON object to the LogStash server. When you view the record in Kibana, you should see any fields parsed out with your grok rule – in this case, we have KAFKADIR, LOGLEVEL, LOGPARTITION, LOGSOURCE, and MESSAGE fields.