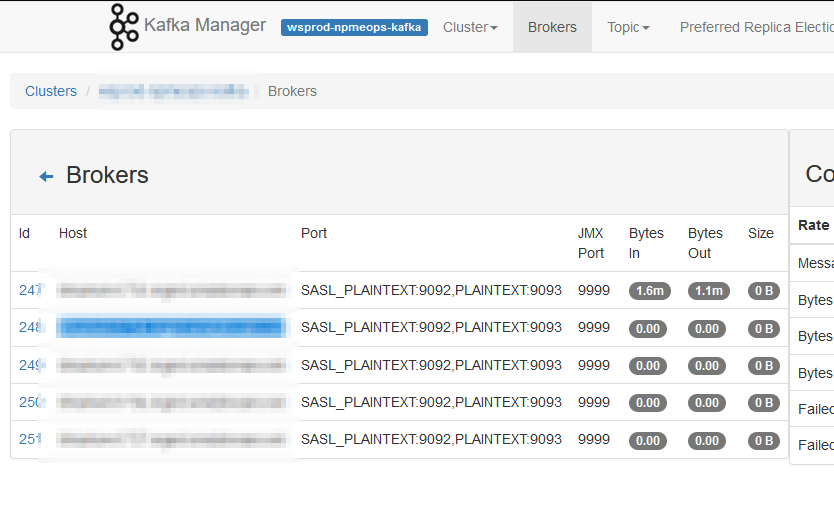
I noticed, today, that our Kafka Manager interface only shows details from one server — the one where we run Kafka Manager. We’ve done everything that we need to do in order to get this working — the port shows as open with nmap, the command to run Kafka includes all of the settings. I’ve even tried setting the JMX hostname, but still there is just one server reporting data
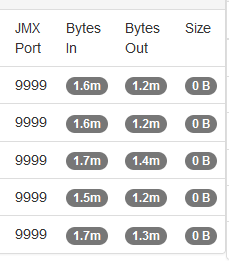
Then I happened across an article online that detailed how JMX actually uses three ports — the configured port 9999 and two other randomly selected and non-configurable ports. I used netstat to list all of the ports in use by the Java PID running my Kafka server and, voila, there were two odd-ball high ports (30000’s and 40000’s). I added those additional ports to the firewall rules and … I’ve got data for all of the Kafka servers!
This is obviously a short-term solution as the two randomly selected ports will be different when I restart the service next time. I’d prefer to leave the firewall in place (i.e. not just open all ports >1024 between the Kafka Manager host and all of the Kafka servers) so might put together a script to identify the “oddball” ports associated to the Java pid and add them to transient firewalld rules. But the last server restart was back in 2021 … so I might just manually add them after the upgrade next week and worry about something ‘better’ next year!
Scott was trying to move some backup files from /a/path/to/backup to /a/path/to-a-different/backup — he’s using Dolphin & has a tab open to each of the folders in question. He chown’d /a/path to his account, chmod’d /a/path so user can read and write. But using the copy/paste option … nothing happens.
I came across a few old (and closed) bugs that seemed to produce errors in this same situation — but the reporters were able to perform their copy/move operations when they used the same tab instead of having one folder open in each tab. It worked … inexplicable, but we have success!
One of our Samba servers — unfortunately the file server — did not show up when browsing the network locations in Dolphin. I map drives from Windows, so it’s not something I’ve really noticed … but Scott is trying to avoid using network mounts and wanted to access everything through “Network”. Several other servers — ones that Scott built — show up, but not the one where we actually store our files.
There’s no salient difference in the samba configurations. But … it turns out that the “newer” way Samba advertises its presence is through mDNS. And I routinely disable the avahi-daemon because, well, I “don’t use” mDNS for anything. Turns out I do use mDNS … so I had to enable and start the avahi-daemon (and restart Samba). Voila, the file server is visible in the list of network places.
I needed to get files from a container image that I couldn’t actually start (not enough memory, and finding a box with more memory wasn’t a reasonable option) — fortunately, you can override the container entrypoint to start the container without actually running whatever the container would normally run.
I needed to copy all of the files under a directory from a docker container — and there is a quick command line that will list the fully qualified path/filename for everything under the current directory:
Since this is the fifth time this month that I’ve spun up some CentOS image and been stymied by the inability to install new packages … I’m going to write down the sed commands that magic the default yum repository configuration to something that’s still functional.
cd /etc/yum.repos.d/
sed -i 's/mirrorlist/#mirrorlist/g' /etc/yum.repos.d/CentOS-*
sed -i 's|#baseurl=http://mirror.centos.org|baseurl=http://vault.centos.org|g' /etc/yum.repos.d/CentOS-*
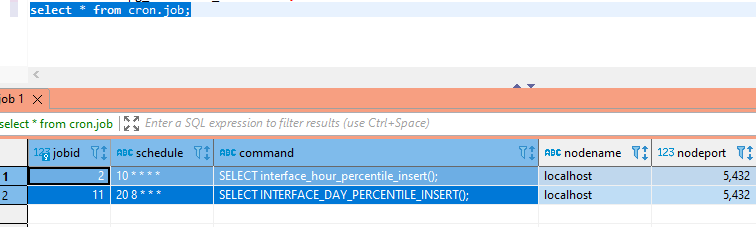
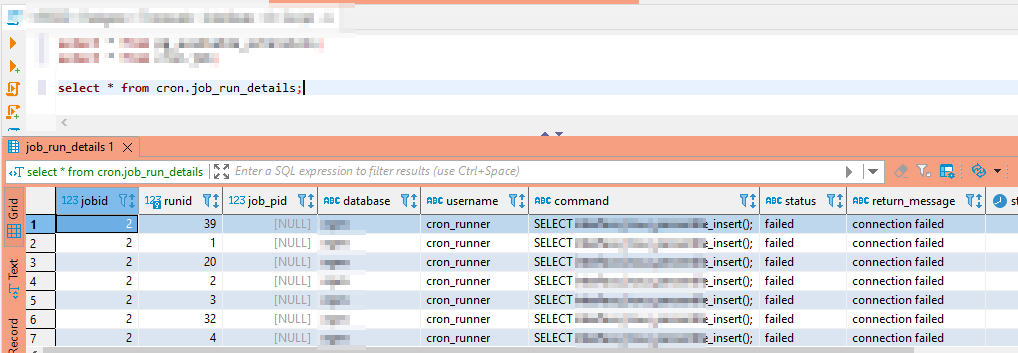
The pg_cron extension allows you to schedule tasks from within your database (or, to those who didn’t know it was a thing, it allows you to hide {really well} jobs that mutate or remove data leading to absolutely inexplicable database content). While the project documents how to create or remove a scheduled job, I had quite the time figuring out how to see what was scheduled.
ElasticSearch, based on the Lucene search software, is a distributed search and analytics application which ingests, stores, and indexes data. Kibana is a web-based front-end providing user access to data stored within ElasticSearch.
What is OpenSearch?
In short, it’s the same but different. OpenSearch is also based on the Lucene search software, is designed to be a distributed search and analytics application, and ingests/stores/indexes data. If it’s essentially the same thing, why does OpenSearch exist? ElasticSearch was initially licensed under the open-source Apache 2.0 license – a rather permissive free software license. ElasticCo did not agree with how their software was being used by Amazon; and, in 2021, the license for ElasticSearch was changed to Server Side Public License (SSPL). One of the requirements of SSPL is that anyone who implements the software and sells their implementation as a service needs to publish their source code under the SSPL license – not just changes made to the original program but all other software a user would require to run the software-as-a-service environment for themselves. Amazon used ElasticSearch for their Amazon Elasticsearch Service offering, but was unable/unwilling to continue doing so under the new license terms. In April of 2021, Amazon Web Services created a fork of ElasticSearch as the basis for OpenSearch.
Differences Between OpenSearch and ElasticSearch
After the OpenSearch fork was created, the product roadmap for ElasticSearch was driven by ElasticCo and the roadmap for OpenSearch was community driven (with significant oversight and input from Amazon) – this means the products are not identical although they provide the same core functionality. Elastic publishes a list of features unique to ElasticSearch, and the underlying machine learning algorithms are different. However, the important components of the “unique” feature list have been implemented in OpenSearch over time.
The biggest differences are price and support. OpenSearch is free software – there is no purchasing a license to unlock features. It does appear that Amazon has an internal iteration of OpenSearch as their as-a-service offering provides features not available in the open-source OpenSearch code base, but that is only available for cloud customers. ElasticCo offers ElasticSearch as free software with a limited feature set. One critical limitation is user authentication mechanisms – we are unable to implement PingID as an authentication source with the free feature set. Advanced features not currently used today – machine learning based anomaly detection, as an example – are also unavailable in the free iteration of ElasticSearch. With an ElasticSearch license, we would also get vendor support. OpenSearch does not offer vendor support, although there are third party companies that will provide support services.
Both OpenSearch and ElasticSearch have community-based support forums available – I have gotten responses from developers on both forums for questions regarding usage nuances.
Salient Feature Comparison
Most companies have a list differentiating their product from the products offered by competitors – but the important thing is how the products differ as it relates to how an individual customer uses the product. A car that can have a fresh cup of espresso waiting for you as you leave for work might be amazing to some people, but those who don’t drink coffee won’t be nearly as impressed. So how do the two products compare for Windstream?
Data ingestion – Data is ingested using the same mechanisms – ElasticCo’s filebeat and logstash are important components of data ingestion, and these components remain unchanged. This means existing processes that feed data into ElasticSearch today would not need to be changed to begin ingesting data into OpenSearch.
Data storage – Both products distribute searchable data over a cluster of servers. Data storage is “tiered” as hot, warm, and cold which allows less used data to reside on slower, less expensive resources. We have confirmed that ingested data is properly housed on cluster nodes designated for ‘hot’ storage and moved to ‘warm’ and ‘cold’ storage as dictated by defined policies. The item count to size ratio is similar between both products (i.e. storing ten million documents takes about the same amount of disk space). OpenSearch provides the ability to alert on transition failures (moving from hot to warm, for instance) which will reduce the amount of manual “health checking” required for the environment.
Search and aggregation – Both products allow both GUI and API searches of indexed data. Data can be aggregated as it is searched – returning the max/min/average value from a search, a count of records matching search criterion, creating sub-aggregations. ElasticSearch does have aggregations not available in OpenSearch, although these could be handled through custom scripted aggregations and many have corresponding GitHub issues requesting such an aggregation be added to OpenSearch (e.g. weighted average, geohash grid, or geotile grid)
auto-interval date histogram
x
categorize text
x
children
x
composite
x
frequent items
x
geohex grid
x
geotile grid
x
ip prefix
x
multi terms
x
parent
x
random sampler
x
rare terms
x
terms
x
variable width histogram
x
boxplot
x
geo-centroid
x
geo-line
x
median absolute deviation
x
rate
x
string stats
x
t-test
x
top metrics
x
weighted avg
x
Alerting – ElastAlert2 can be used to provide the same index monitoring and alerting functionality that ElastAlert currently provides with ElasticSearch. Additionally, OpenSearch includes a built-in alerting capability that might allow us to streamline the functionality into the base OpenSearch implementation.
API Access – Both ElasticSearch and OpenSearch provide API-based access to data. Queries to the ElasticSearch API endpoint returned expected data when directed to the OpenSearch API endpoint. The ElasticSearch python module can be used to access OpenSearch data, although there is a specific OpenSearch module as well.
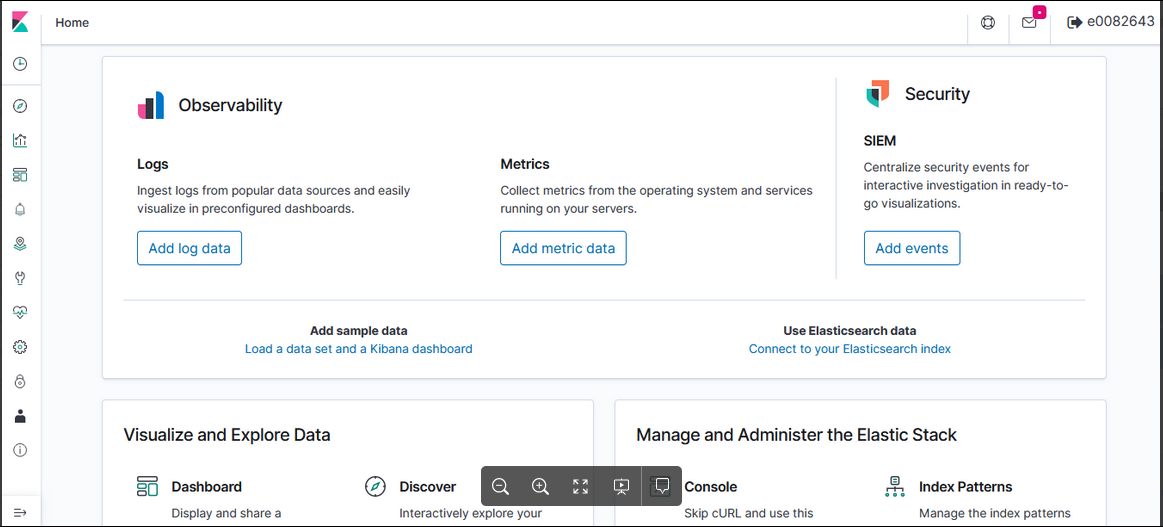
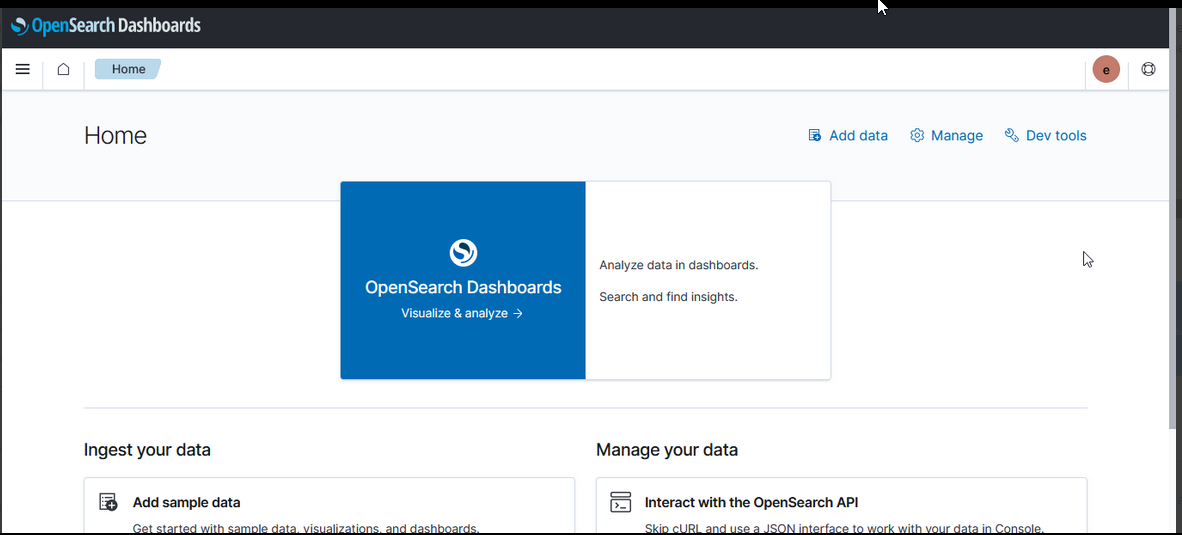
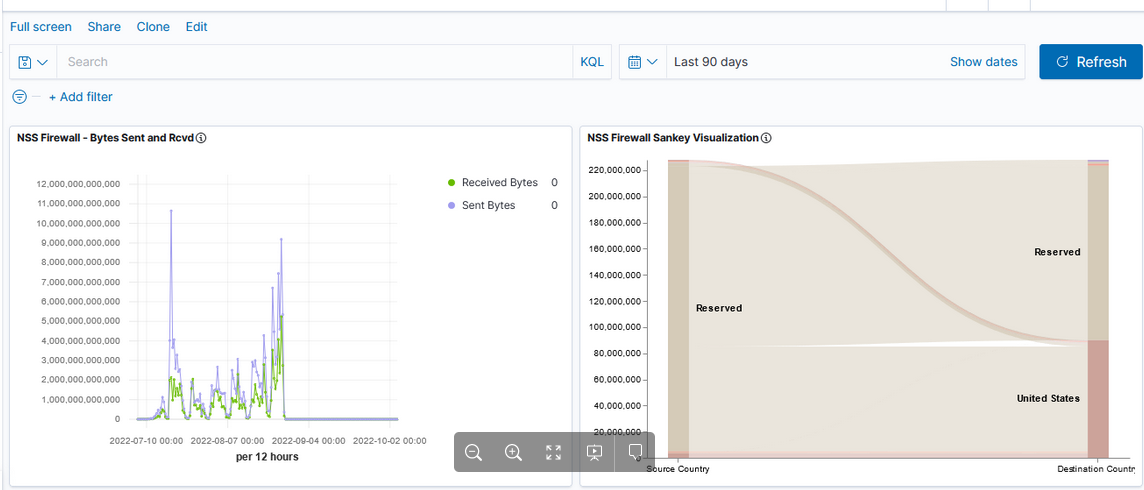
UX – ElasticSearch allows users to search and visualize data through Kibana; OpenSearch provides graphical user access in OpenSearch Dashboard. While the “look and feel” of the GUI differs (Kibana 8 looks different than the Kibana 7 we use today, too), the user functionality remains the same.
Kibana 7.7
OpenSearch Dashboards 2.2
Kibana uses “KQL” – Kibana Query Language – to compose searches while OpenSearch Dashboards uses “DQL” – Dashboards Query Language, but queries used in Kibana were used in OpenSearch Dashboard without modification.
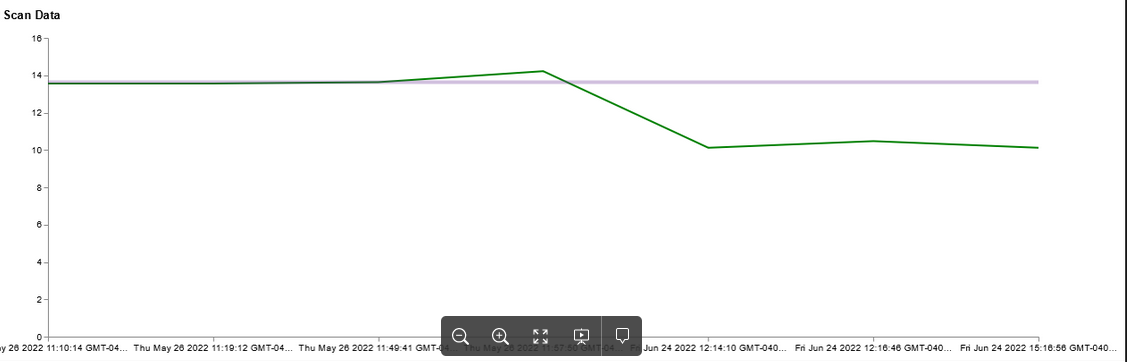
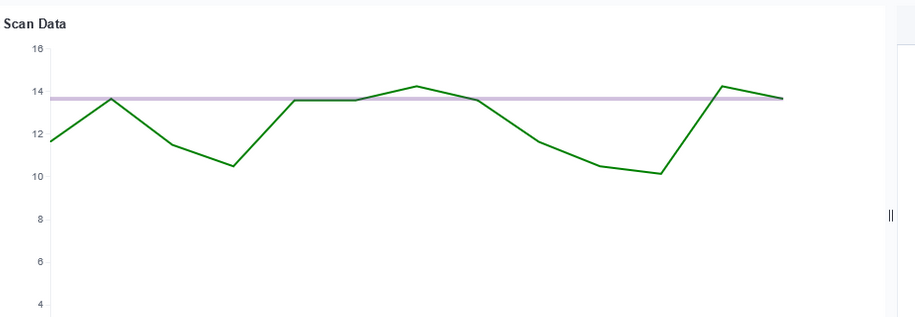
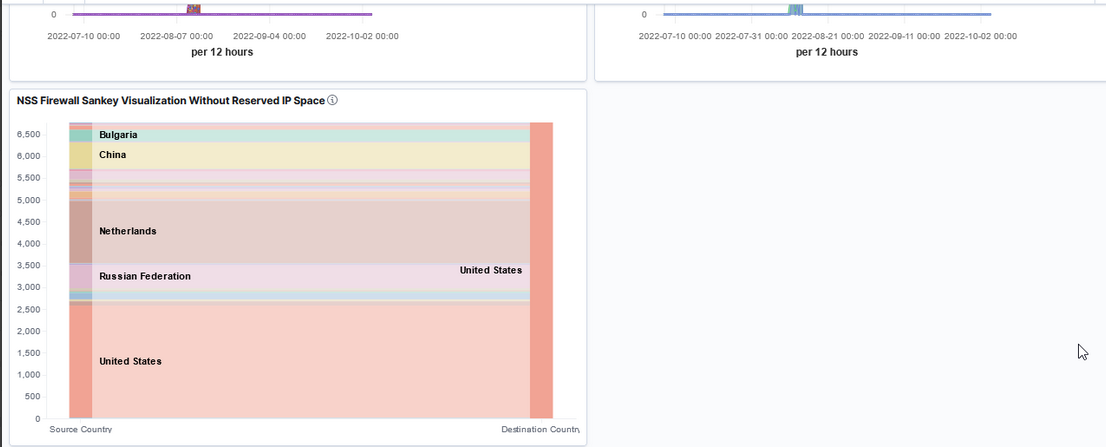
Currently used visualizations are available in both Kibana and OpenSearch Dashboards
Kibana Visualization
OpenSearch Dashboards Visualization
But there are some currently unused visualizations that are unique to each product.
Area
x
x
Controls
x
x
Data Table
x
x
Gauge
x
x
Goal
x
x
Heat Map
x
x
Horizonal Bar
x
x
Lens
x
Line
x
x
Maps
x
Markdown
x
x
Metric
x
x
Pie
x
x
Tag Cloud
x
x
Timeline
x
x
TSVB
x
x
Vega
x
x
Vertical Bar
x
x
Coordinate Map
x
Gantt Chart
x
Region Map
x
Dashboards can be used to group visualizations.
Kibana
OpenSearch Dashboards
New features will be available in either OpenSearch or a licensed installation of ElasticSearch. Currently data is either retained as written or aged out of the system to save disk space. Either path allows us to roll up data – as an example retaining the total number of users per month or total bytes per month instead of retaining each detailed record. Additionally, we will be able to use the “anomaly detection” which is able to monitor large volumes of index data and highlight unusual events. Both newer ElasticSearch versions and OpenSearch offer a Tableau connector which may make data stored in the platform more accessible to users.
Sorry, again, Anya … I really mean it this time. Restart your ‘no posting about computer stuff’ timer!
I was able to cobble together a functional configuration to authenticate users through an OpenID identity provider. This approach combined the vendor documentation, ten different forum posts, and some debugging of my own. Which is to say … not immediately obvious.
Importantly, you can enable debug logging on just the authentication component. Trying to read through the logs when debug logging is set globally is unreasonable. To enable debug logging for JWT, add the following to config/log4j2.properties
On the OpenSearch servers, in ./config/opensearch.yml, make sure you have defined plugins.security.ssl.transport.truststore_filepath
While this configuration parameter is listed as optional, something needs to be in there for the OpenID stuff to work. I just linked the cacerts from our JDK installation into the config directory.
If needed, also configure the following additional parameters. Since I was using the cacerts truststore from our JDK, I was able to use the defaults.
plugins.security.ssl.transport.truststore_type
The type of the truststore file, JKS or PKCS12/PFX. Default is JKS.
plugins.security.ssl.transport.truststore_alias
Alias name. Optional. Default is all certificates.
Note that subject_key and role_key are not defined. When I had subject_key defined, all user logon attempts failed with the following error:
[2022-09-22T12:47:13,333][WARN ][c.a.d.a.h.j.AbstractHTTPJwtAuthenticator] [UOS-OpenSearch] Failed to get subject from JWT claims, check if subject_key 'userId' is correct.
[2022-09-22T12:47:13,333][ERROR][c.a.d.a.h.j.AbstractHTTPJwtAuthenticator] [UOS-OpenSearch] No subject found in JWT token
[2022-09-22T12:47:13,333][WARN ][o.o.s.h.HTTPBasicAuthenticator] [UOS-OpenSearch] No 'Basic Authorization' header, send 401 and 'WWW-Authenticate Basic'
Finally, use securityadmin.sh to load the configuration into the cluster:
Restart OpenSearch and OpenSearch Dashboard — in the role mappings, add custom objects for the external user IDs.
When logging into the Dashboard server, users will be redirected to the identity provider for authentication. In our sandbox, we have two Dashboard servers — one for general users which is configured for external authentication and a second for locally authenticated users.
(Sorry, Anya … after today, I’ll try to not post anything about computers for three days!) Linux restricts non-root users from opening ports <1024. It’s generally a good idea not to run your services as root. Which means, unfortunately, we end up running a lot of services on nonstandard ports (so frequently that 1389 and 1636 are a quasi-standard port for LDAP and LDAPS, 8080 and 8443 quasi-standard ports for HTTP and HTTPS). But having to remember to add the nonstandard port to a web URL is an annoyance for users — I’ve seen a lot of people fix this by adding a load balanced VIP or NGINX proxy in front of the service to handle port translations. But there is a quick and easy way to handle port translation without any additional equipment. Most Linux hosts have firewalld running, and you can tell the firewall to forward the port for you. In this example, I’m letting my Kibana users access my web service using https://kibana.example.com without needing to append the :5601:
Should you decide against the port forwarding, the same command with –remove-forward-port deregisters the rule: firewall-cmd –zone=public –remove-forward-port=port=443:proto=tcp:toport=5601