Category: System Administration

Tracking Down Which Pod is Exhausting IP Connections

We’ve been seeing an error that prevents clients from connecting to Postgresql servers – basically that all available connections are in use and the remaining connections are reserved for superuser and replication activity.

First, we need to determine what the connection limit is

SELECT setting, source, sourcefile, sourceline FROM pg_settings WHERE name = 'max_connections';

And if there are any per-user connection limits – a limit of -1 means unlimited connections are allowed.

SELECT rolname, rolconnlimit FROM pg_roles

The next step is to identify what connections are exhausting available connections – are there a lot of long-running queries? Are there just more active queries than anticipated? Are there a bunch of idle connections?

SELECT pid, usename, client_addr, client_port 
 ,to_char(pg_stat_activity.query_start, 'YYYY-MM-DD HH:MI:SS') as query_start
 , state, query 
FROM pg_stat_activity
-- where state = 'idle'
-- and usename = 'app_user'
order by query_start;

In our case, there were over 100 idle connections using up about 77% of the available connections. Auto-vacuum, client read operations, and replication easily filled up the remaining available connections.

Because the clients keeping these idle connections open are an app running in a Kubernetes cluster, there’s an extra layer of complexity identifying where the connection is actually sourced. When you view the list of connections from the Postgresql server’s perspective, “client_addr” is the worker hosting the pod.

On the worker server, use conntrack to identify the actual source of the connection – the IP address in “-d” is the IP address of the Postgresql server. To isolate a specific connection, select a “client_port” from the list of connections (37900 in this case) and grep for the port. You will see the src IP of the individual POD.

lhost1750:~ # conntrack -L -f ipv4 -d 10.24.29.140 -o extended | grep 37900
ipv4 2 tcp 6 86394 ESTABLISHED src=10.244.4.80 dst=10.24.29.140 sport=37900 dport=5432 src=10.24.29.140 dst=10.24.29.155 sport=5432 dport=37900 [ASSURED] mark=0 use=1
conntrack v1.4.4 (conntrack-tools): 27 flow entries have been shown.

Then use kubeadm to identify which pod is assigned that address:

lhost1745:~ # kubectl get po --all-namespaces -o wide | grep "10.244.4.80"
kstreams kafka-stream-app-deployment-1336-d8f7d7456-2n24x 2/2 Running 0 10d 10.244.4.80 lhost0.example.net <none> <none>

In this case, we’ve got an application automatically scaling up that can have 25 connections help open and idle … so there isn’t really a solution other than increasing the number of available connections to a number that’s appropriate given the number of client connections we plan on leaving open. I also want to enact a connection limit on the individual account – if there are 250 connections available on the Postgresql server, then limit the application to 200 of those connections.


2>/dev/null

A few times now, I’ve encountered individuals with cron jobs or bash scripts where a command execution ends in 2>/dev/null … and the individual is stymied by the fact it’s not working but there’s no clue as to why. The error output is being sent into a big black hole never to escape!

The trick here is to understand file descriptors — 1 is basically a shortcut name for STDOUT and 2 is basically a shortcut name for STDERR (0 is STDIN, although that’s not particularly relevant here).  So 2>/dev/null says “take all of the STDERR stuff and redirect it to /dev/null”.

Sometimes you’ll see both STDERR and STDOUT being redirected either to a file or to /dev/null — in that case you will see 2>&1 where the ampersand prior to the “1” indicates the stream is being redirected to a file descriptor (2>1 would direct STDOUT to a file named “1”) — so >/dev/null 2>&1 is the normal way you’d see it written. Functionally, >/dev/null 1>&2 would be the same thing … but redirecting all output into error is, conceptually, a little odd.

To visualize all of this, use a command that will output something to both STDERR and STDOUT — for clarify, I’ve used “1>/dev/null” (redirect STDOUT to /devnull) in conjunction with 2>&1 (redirect STDERR to STDOUT). As written in the text above, the number 1 is generally omitted and just >/dev/null is written.


Reporting Last Patch Dates on Fedora / RedHat / CentOS Systems

I needed to verify the last time a bunch of servers were patched — basically to ensure compliance with the stated quarterly patching interval. This python script pulls the list of installed packages and the date for each package, sorts the info by date DESC, and then reports the latest date on any packages — as well as the number of packages updated on that date. If there’s only one … the system still might bear some investigation. But if a couple of dozen packages were updated in the past quarter … we don’t need to be too worried about turning up on the out-of-compliance report.

import subprocess
import re
import datetime
from collections import OrderedDict

def getFirstElement(odictInput):
    '''
        This function returns the first element from an ordered collection (an arbitrary element if an unordered collection is passed in)
        Input -- odictInput -- ordered collection
        Output -- type varies -- first element of ordered collection, arbitrary element of unordered collection

    '''
    return next(iter(odictInput))

listHosts = ['host01.example.com', 'host02.example.com', 'host03.example.com','host04.example.com','host05.example.com']

for strHost in listHosts:
        dictPatchDates = {}

        objResults = subprocess.Popen(['ssh', strHost, 'rpm', '-qa', '--last'],stdout=subprocess.PIPE)
        for strLine in objResults.stdout:
                strPackageInfo  = strLine.decode('utf-8').rstrip()
                listPackageInfo = re.split(r'\s*([a-zA-Z]{3,}\s[0-9]{2,}\s[a-zA-Z]{3,}\s[0-9]{2,})',strPackageInfo)
                strUpdateDate = listPackageInfo[1]
                dateUpdateDate = datetime.datetime.strptime(strUpdateDate, "%a %d %b %Y").date()
                if dictPatchDates.get(dateUpdateDate) is not None:
                        dictPatchDates[dateUpdateDate] = dictPatchDates[dateUpdateDate] + 1
                else:
                        dictPatchDates[dateUpdateDate] = 1

        dictOrderedPatchDates = OrderedDict(sorted(dictPatchDates.items(), key=lambda t: t[0],reverse=True))
        dateLatestPatch = getFirstElement(dictOrderedPatchDates)
        print(f"{strHost}\t{dateLatestPatch}\t{dictOrderedPatchDates[dateLatestPatch]}")

Building Gerbera on Fedora

There is a great deal of documentation available for building Gerbera from source on a variety of Linux flavors. Unfortunately, Fedora isn’t one of those (and the package names don’t exactly match up to let you replace “apt-get” with “yum” and be done). So I am quickly documenting the process we followed to build Gerbera from source.

The Fedora build of Gerbera has the binaries in /usr/bin and the manual build places the gerbera binary in /usr/local/bin — the build updates the unit file to reflect this change, but this means you want to back up any customizations you’ve made to the unit file before running “make install”.

You need the build system — cmake, g++, etc and the devel packages from the following table as required by your build options

Additional packages that we needed to install: automake, autoconf, libtool

Library Fedora Package Required? Note Compile-time option Default
libpupnp libupnp-devel XOR libnpupnp pupnp
libnpupnp Build from source (if needed) XOR libupnp I was only able to locate this as a source, not available from Fedora repos WITH_NPUPNP Disabled
libuuid libuuid-devel Required Not required on *BSD
pugixml pugixml-devel Required XML file and data support
libiconv glibc-headers Required Charset conversion
sqlite3 sqlite-devel Required Database storage
zlib zlib-devel Required Data compression
fmtlib fmt-devel Required Fast string formatting
spdlog spdlog-devel Required Runtime logging
duktape duktape-devel Optional Scripting Support WITH_JS Enabled
mysql mariadb-devel Optional Alternate database storage WITH_MYSQL Disabled
curl libcurl-devel Optional Enables web services WITH_CURL Enabled
taglib taglib-devel Optional Audio tag support WITH_TAGLIB Enabled
libmagic file-devel Optional File type detection WITH_MAGIC Enabled
libmatroska libmatroska-devel Optional MKV metadata required for MKV WITH_MATROSKA Enabled
libebml libebml-devel Optional MKV metadata required for MKV WITH_MATROSKA Enabled
ffmpeg/libav ffmpeg-free-devel Optional File metadata WITH_AVCODEC Disabled
libexif libexif-devel Optional JPEG Exif metadata WITH_EXIF Enabled
libexiv2 exiv2-devel Optional Exif, IPTC, XMP metadata WITH_EXIV2 Disabled
lastfmlib liblastfm-devel Optional Enables scrobbling WITH_LASTFM Disabled
ffmpegthumbnailer ffmpegthumbnailer-devel Optional Generate video thumbnails WITH_FFMPEGTHUMBNAILER Disabled
inotify glibc-headers Optional Efficient file monitoring WITH_INOTIFY
libavformat libavformat-free-devel Required for 2.0
libavutil libavutil-free-devel Required for 2.0
libavcodec libavcodec-free-devel Required for 2.0

Then follow the generalized instructions — cd into the folder where you want to run the build and run (customizing the cmake line as you wish):

git clone https://github.com/gerbera/gerbera.git
mkdir build
cd build
cmake ../gerbera -DWITH_MAGIC=1 -DWITH_MYSQL=1 -DWITH_CURL=1 -DWITH_INOTIFY=1 -DWITH_JS=1 -DWITH_TAGLIB=1 -DWITH_AVCODEC=1 -DWITH_FFMPEGTHUMBNAILER=0 -DWITH_EXIF=1 -DWITH_EXIV2=1 -DWITH_SYSTEMD=1 -DWITH_LASTFM=0 -DWITH_DEBUG=1
make -j4
sudo make install

As with the Gerbera binary, the Fedora build places the web content in /usr/share/gerbera and the manual build places the web content into /usr/local/share/gerbera — yes, you can change the paths in the build, and I’m sure you can clue Gerbera into the new web file location. I opted for the quick/easy/lazy solution of running

mv /usr/share/gerbera /usr/share/gerbera/old
ln -s /usr/local/share/gerbera /usr/share/

To symlink the location my config thinks the web components should be located to the new files.

On the first start of Gerbera, SQL scripts may be run to update the database — don’t stop or kill the service during this process there’s no checkpoint restart of the upgrade process. We backed up /etc/gerbera/gerbera.db prior to starting our Gerbera installation. We’ve also wiped the database files to start from scratch and test changes that impacted how items are ingested into the database.

Fin.

Apache HTTPD Log File Analysis — Hits by IP Address

When we are decommissioning a website (or web server), I always watch the log files to ensure there aren’t a lot of people still accessing it. Sometimes there are and it’s worth tracking them down individually to clue them into the site’s eminent demise. Usually there aren’t, and it’s just a confirmation that our decommissioning efforts won’t be impactful.

This python script looks for IP addresses in the log files and outputs each IP & it’s access count per log file. Not great if you’ll see a bunch of IP addresses in the recorded URI string, but it’s good enough for 99% of our log data.

import os
import re
from collections import Counter

def parseApacheHTTPDLog(strLogFile):
    regexIPAddress = r'\d{1,3}\.\d{1,3}\.\d{1,3}\.\d{1,3}'

    with open(strLogFile) as f:
        objLog = f.read()
        listIPAddresses = re.findall(regexIPAddress,objLog)
        counterAccessByIP = Counter(listIPAddresses)
        for strIP, iAccessCount in counterAccessByIP.items():
            print(f"{strLogFile}\t{str(strIP)}\t{str(iAccessCount)}")

if __name__ == '__main__':
    strLogDirectory = '/var/log/httpd/'
    for strFileName in os.listdir(strLogDirectory):
        if strFileName.__contains__("access_log"):
        #if strFileName.__contains__("hostname.example.com") and strFileName.__contains__("access_log"):
            parseApacheHTTPDLog(f"{strLogDirectory}{strFileName}")

Reverse Proxying WebSockets through mod_proxy — HTTP Failback

I’ve been successfully reverse proxying MQTT over WebSockets via Apache HTTPD for quite some time now. The last few weeks, my phone isn’t able to connect. There’s no good rational presented (and manually clicking the “send data” button on my client successfully connects). It was time to upgrade the server anyway. Once I got the latest Linux distro on the server, I couldn’t connect at all to my MQTT server. The error log showed AH00898: Error reading from remote server returned by /mqtt

Evidently, httpd 2.4.47 added functionality to upgrade and tunnel in accordance with RFC 7230. And that doesn’t work at all in my scenario. Haven’t dug in to the why of it yet, but adding ProxyWebsocketFallbackToProxyHttp Off to the reverse proxy config allowed me to successfully communicate with the MQTT server through the reverse proxy.

(Not) Finding the Rygel Log File

We’ve spent a lot of time trying to get a log file from the rygel server … setting the log level in the config file didn’t seem to do anything useful. And I cannot even find a log file. The only output we’re able to find is formed by running the binary from the command line. Where is that log file?!? Hey — there isn’t one. All of this log level setting has to do with what’s written to STDOUT and STDERR. You can either modify the unit file to tee the output off to a file or run it from the command line

To get debugging output, use

G_MESSAGES_DEBUG=all rygel -g 5

To tee the output off to a file,
rygel -g *:5 2>&1 | tee -a /path/to/rygel.log


Brinqa Remediation – mDNS

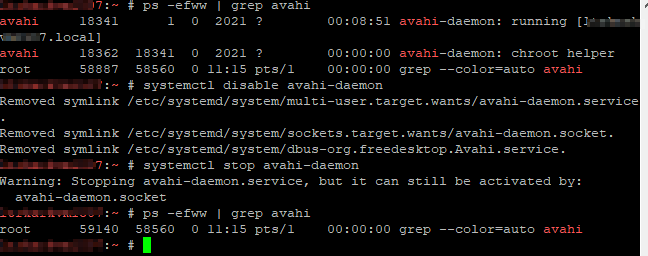
Some systems were found to be responding to mDNS requests (5353/udp). Linux hosts were running the avahi-daemon which provides this service. As the auto-discovery service is not used for service identification, the avahi-daemon was disabled.

Confirm response is seen on 5353/udp prior to change:

nmap -P0 -p 5353 -sU hostname.example.net

SSH to host identified as responding to mDNS requests. Disable the avahi-daemon then stop the avahi-daemon:

systemctl disable avahi-daemon
systemctl stop avahi-daemon


Verify that 5353/udp is no longer open by repeating the nmap command.

Fin.

Useful Bash Commands

Viewing Log Files

Tailing the File

When the same file name is used when logs are rotated (i.e. app.log is renamed to app.yyyymmdd.log and a new app.log is created), use the -F flag to follow the name instead of the file descriptor

tail -F /var/log/app.log

Tailing with Filtering

When you are looking for something specific in the log file, it often helps to run the log output through grep. This example watches a sendmail log for communication with the host 10.5.5.5

tail -F /var/log/maillog | grep "10.5.5.5"

Handling Log Files with Date Specific Naming

I alias out commands for viewing commonly read log files. This is easy enough when the current log file is always /var/log/application/content.log, but some active log files have date components in the file name. As an example, our Postgresql servers have the short day-of-week string in the log. Use command substitution to get the date-specific elements from the date executable. Here, I tail a file named postgresql-Tue.log on Tuesday. Since logs rotate to a new name, tail -F doesn’t really do anything. You’ll still need to ctrl-c the tail and restart it for the next day.

tail -f /pgdata/log/postgresql-$(date +%a).log

Apache HTTPD and DER Encoded Certificate

We are in the process of updating one of the web servers at work to a newer OS – along with a newer Apache HTTPD and PHP iteration. Ran into a snag just setting up the SSL web site – we couldn’t get HTTPD started with our Venafi certificate.

[Fri Jan 28 14:35:05.092086 2022] [ssl:emerg] [pid 57739:tid 139948816931136] AH02561: Failed to configure certificate hostname.example.com:443:0, check /path/to/certs/production/server.crt

[Fri Jan 28 14:35:05.092103 2022] [ssl:emerg] [pid 57739:tid 139948816931136] SSL Library Error: error:0909006C:PEM routines:get_name:no start line (Expecting: CERTIFICATE) — Bad file contents or format – or even just a forgotten SSLCertificateKeyFile?

[Fri Jan 28 14:35:05.092115 2022] [ssl:emerg] [pid 57739:tid 139948816931136] SSL Library Error: error:140AD009:SSL routines:SSL_CTX_use_certificate_file:PEM lib

The certificate was DER encoded – that’s not what I use, but it was working on the old server.

I think there might be something between httpd-2.4.6-97 and httpd-2.4.37-43 that stopped DER encoded certificates from working. Rather than figure out some way to coerce HTTPD to use this DER file that I don’t really care if I’ve got … I just used a quick command to export the B64 version of the certificate, copied the header/footer/stuff in between, and made a base-64 encoded certificate file.

openssl x509 -inform DER -in server.crt | openssl x509 -text

And, voila, we’ve got a web server.