I am a big fan of “undo” – highlighted something to copy it but missed the ‘ctrl’ part of ctrl-c? Undo! Editing an image and drew a line the wrong place? Undo! Change some verbiage and regret the modifications? Undo! (I’ll generally copy the stuff I’ve added into a new document before I start hitting ctrl-z {the keyboard shortcut for undo} and incorporate a few of the new ideas into the original text.) Occasionally, you run out of undo-able operations. If you are saving to OneDrive, SharePoint, or Teams, you can use the version history to get back to your original content. But did you know that PowerPoint allows you to increase the number of undo operations available?
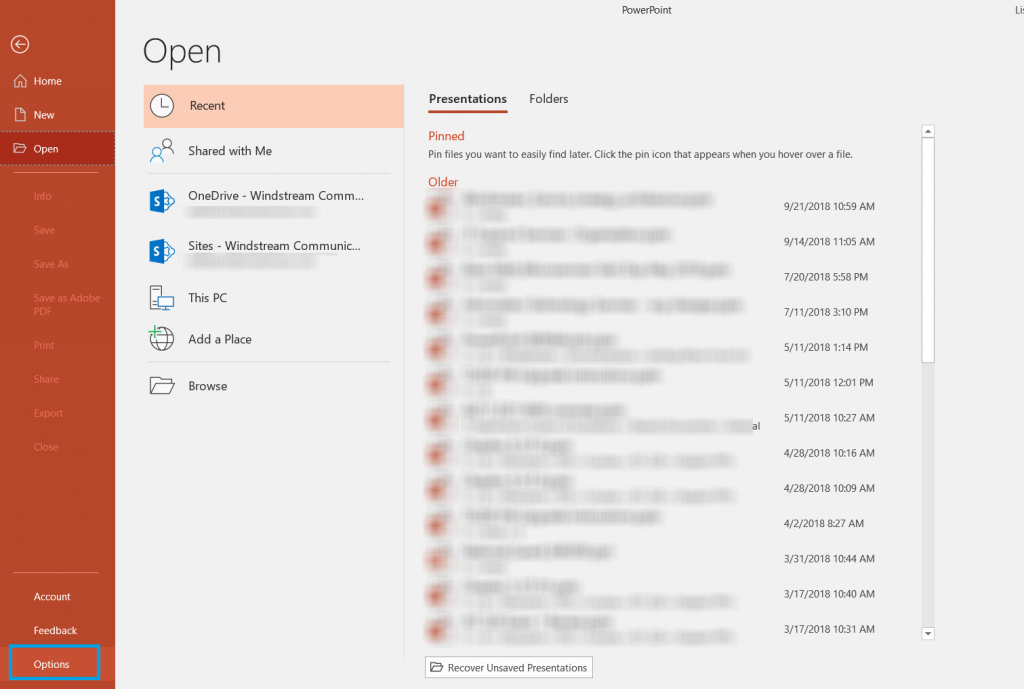
Click “File” on the ribbon bar and select “Options”
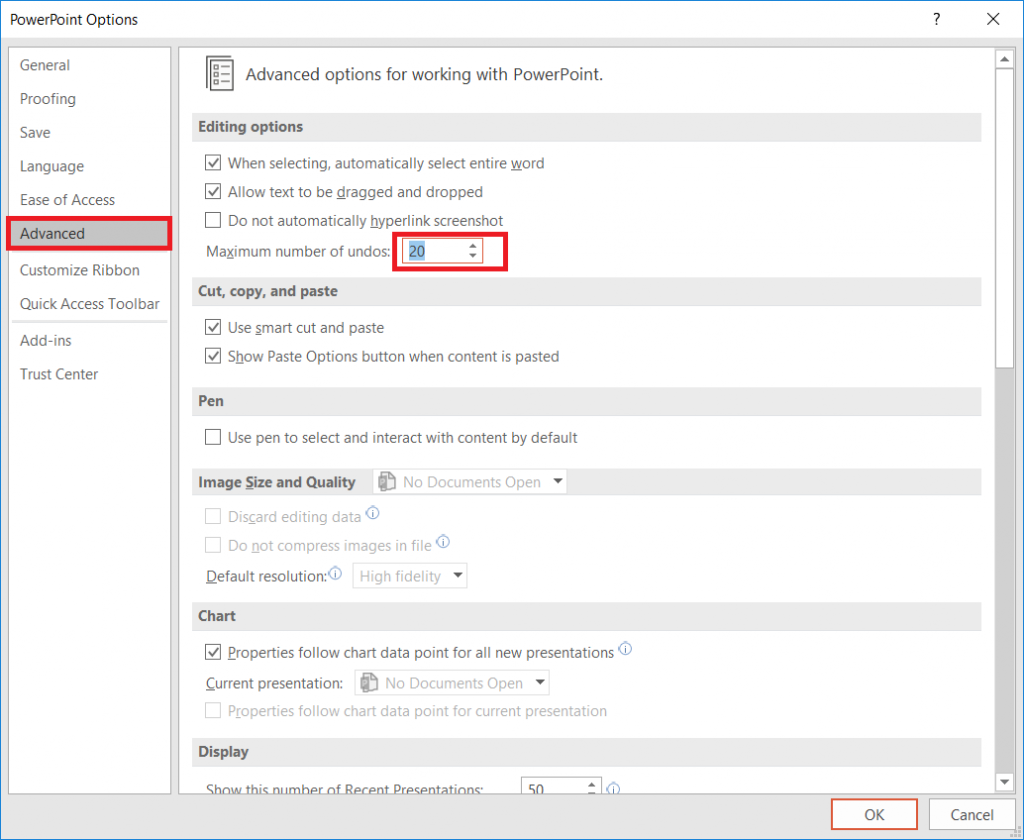
Select “Advanced”. Under “Editing options”, you will see a
maximum number of undos – this value defaults to 20.
You can increase it up to 150 – although higher numbers can
adversely impact performance, so stick to a lower number unless you really want to undo a hundred operations!
There are a lot of tools we use at work that are silly
overkill in your personal life – I don’t want to open a Remedy ticket for every
squeaky hinge! But some of our tools are quite helpful away from work too – making
flyers in Word or using Excel to keep track of the softball league standings. “Is
Teams useful in my personal life” seems like a purely hypothetical question –
it’s not like I can invite the rest of the Parent Teacher Organization to join
us here in Teams (and even if I could, that’s hardly an appropriate use of
company resources!). But did you know Microsoft offers a free version of Teams?
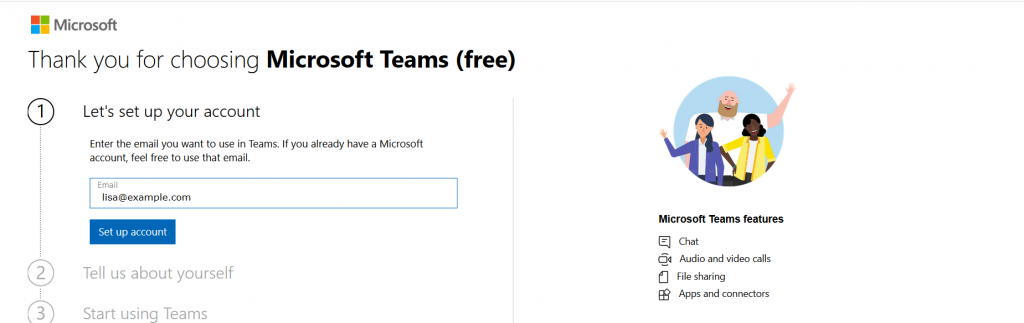
Signing up for a free account, you don’t get access to all of the Teams features we’ve got here – you cannot schedule meetings, record meetings, there isn’t a Planner board, you don’t have access to the full suite of Office 365 applications. But you do have a Teams space, can use the integrated apps and connectors, have some file storage space, have persistent chats in channels, and can even have group audio/video calls.
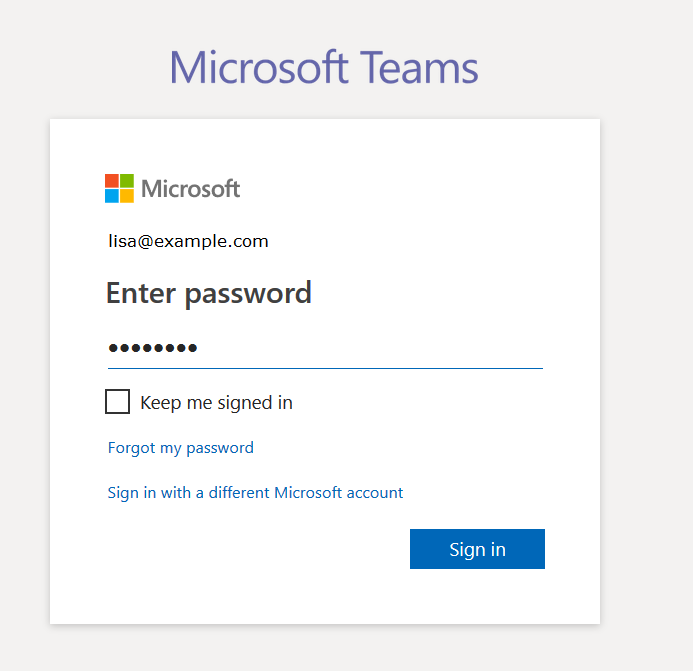
Don’t use your company e-mail address to sign up – this will
need to be your personal address.
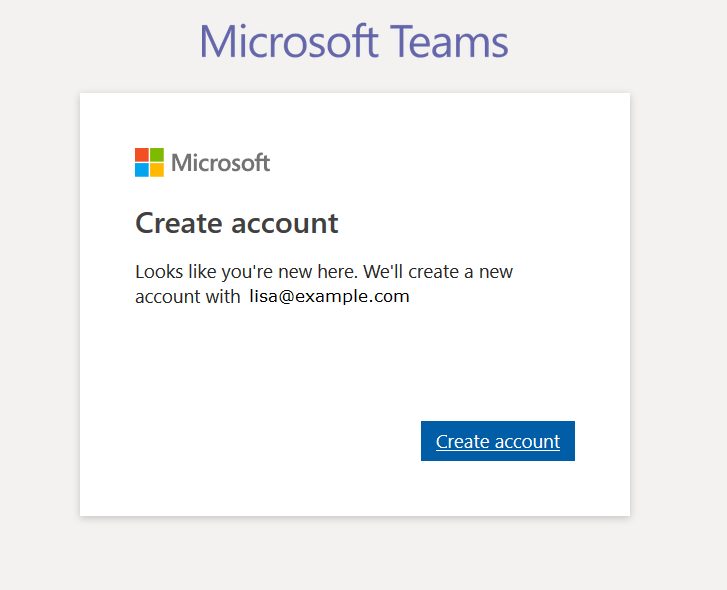
If you don’t already have a Microsoft account associated
with the e-mail address, you’ll be asked to create a new Microsoft account.
Otherwise you’ll be asked to sign in to your Microsoft
account.
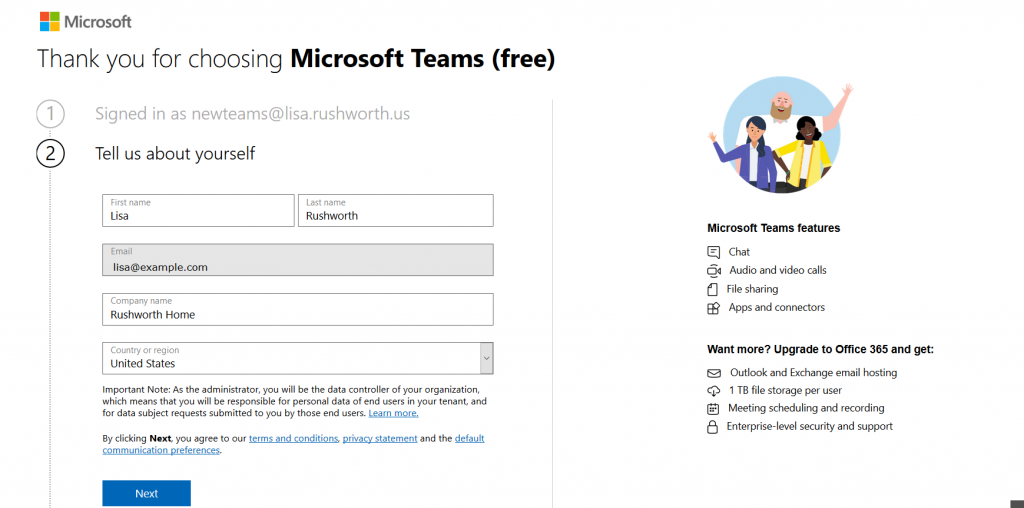
Supply your name, organization name, and country of origin.
Read the terms of use and privacy statement. Assuming your use complies with
the terms of use and the privacy policy is acceptable, click “Next”
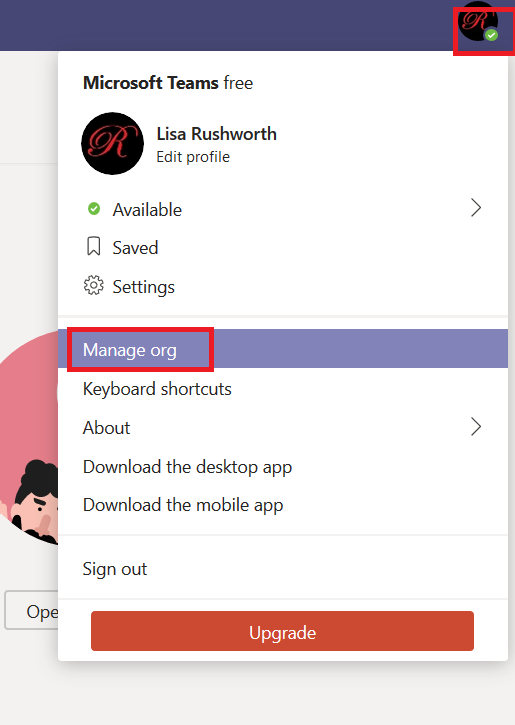
It will take a few minutes for everything to be set up. Once
your personal Teams organization is built, you can invite others to join. Click
on your avatar in the upper right-hand corner of the screen and select “Manage
org”
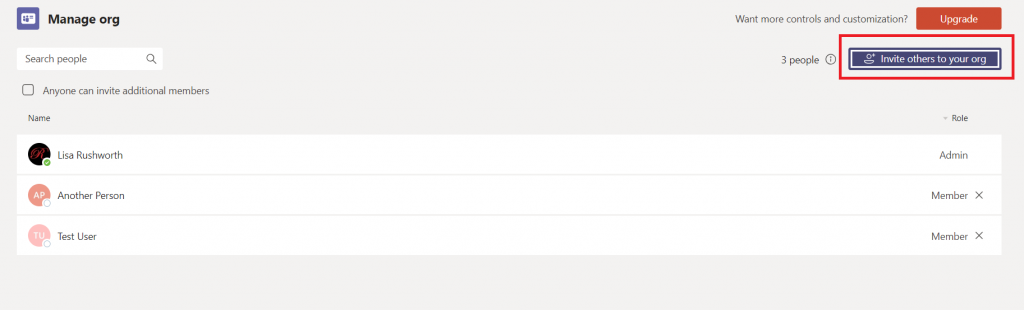
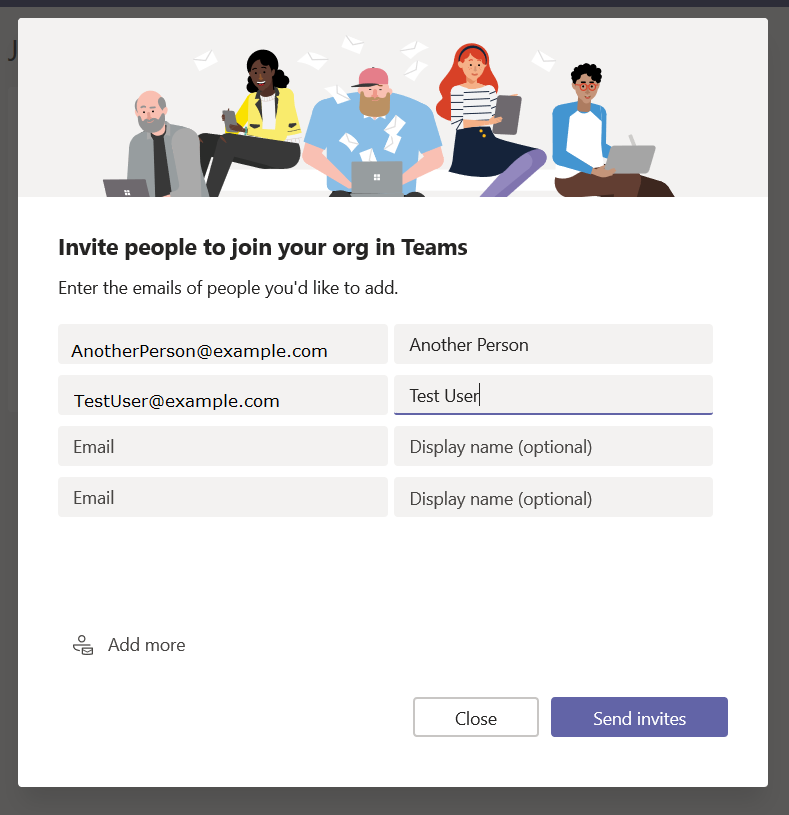
Click “Invite others to your org”
And enter their e-mail addresses
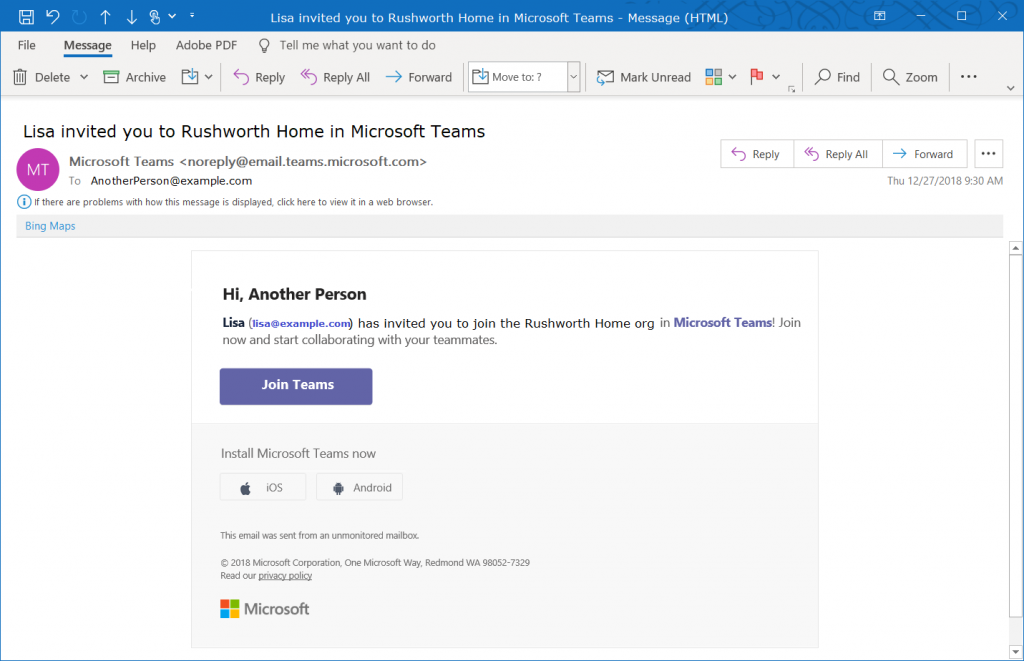
They will get an e-mail message inviting them to join your
Teams org.
You’re ready to start using Teams – add tabs to websites
your group commonly uses, set up connectors, create new channels, chat, video
calls, share files. You can even add new Teams to your organization.
Everyone added to your org is automatically able to access
the default Teams space (the one with the name of your org). Teams spaces you create can be private or public,
just like at work – but you can also select “Org-wide” which automatically
joins any newly-added individuals to the Teams space.
One drawback to retaining all of your chat and team discussion content is that there’s a LOT
of content … which makes it challenging to find a specific discussion or
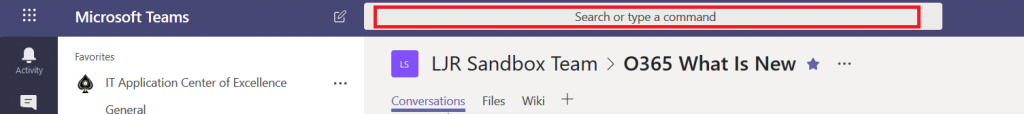
comment. Luckily, Teams data is easily searched. At the top of your Teams
application (or website), there is a long gray bar. Click in it and type a word
or phrase to begin searching. Using multiple words will find conversations
containing both words, to find a phrase place the phrase “in quotes”. Hit enter.
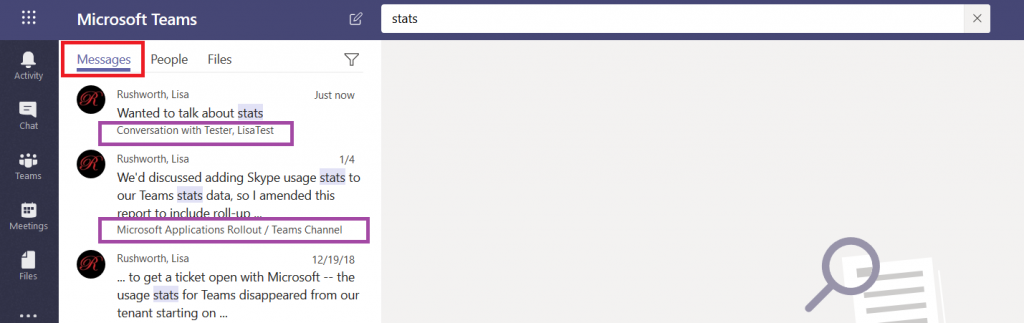
You’ll see messages that contain the words or phrase –
notice this includes both chat messages and channel discussions. Each search
result has a reference letting you know where the discussion is located, and
you can click on the item to switch to the chat or channel discussion.
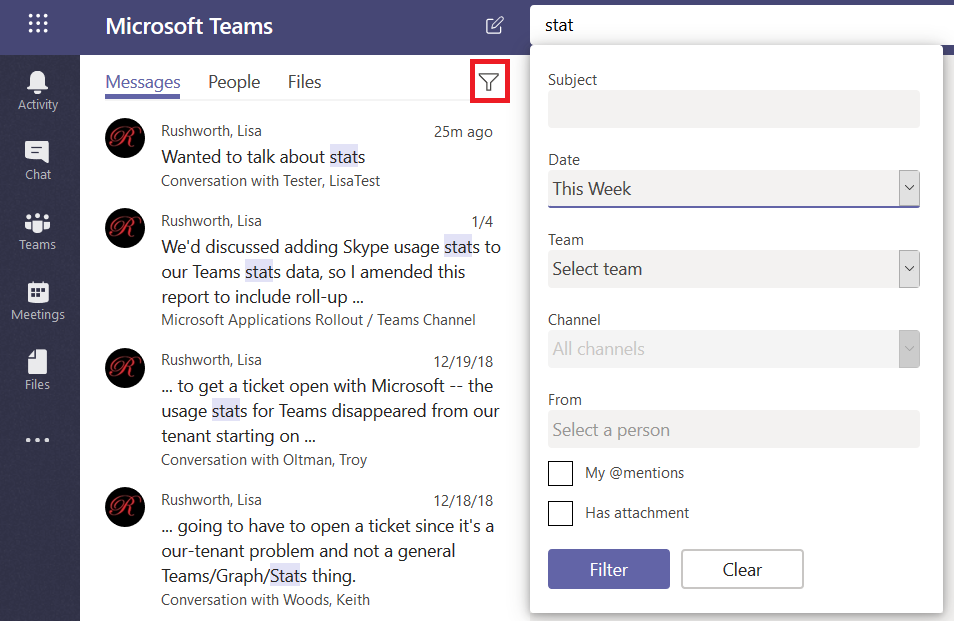
If your search returns too many results, click on the little
funnel – you can refine your search results with a filter – a specific
individual, a time frame.
In addition to searching chat messages, you can search files.
Just click on “Files” and you’ll see files with names or content that contain
your search terms. Again, you can see where the file is located, and you can
click on the file to preview the file.
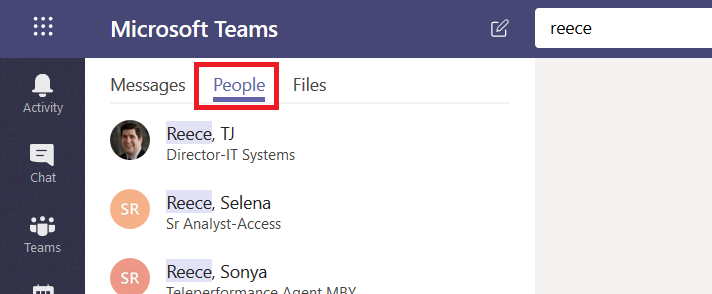
Click on “People” and you’ll find, well, people who work here.
This is a name search – you cannot search for “stats” and see people with whom you’ve
had discussions about statistics. Search for a last name, a first name, or a
name in “last, first” format.
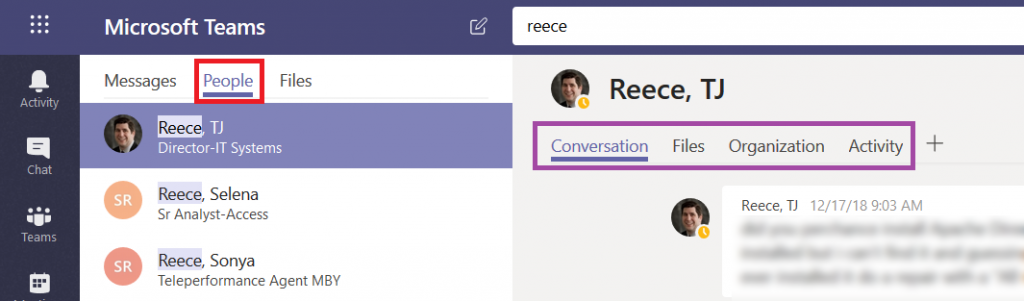
If you click on a person, you’ll see the conversations you
have had with them, as well as any shared files, an org chart for their
position in the company, and their channel posts for the past two weeks (‘Activity’).
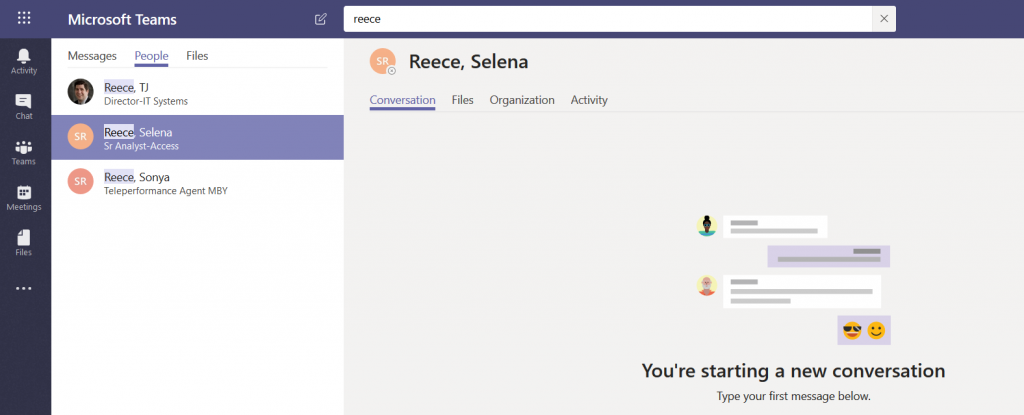
If you haven’t chatted with them before, you can start a new
conversation too.
As I’ve been writing these “Did you know” blog posts, I’ve needed
sample data to demonstrate how a function works. In Excel, that’s easy enough
as there are RAND()
and RANDBETWEEN(iLow,iHigh)
functions. But how do you get sample text in Word? I used to just paste in part
of a public domain work (as a cultural aside – the twenty years of copyright
protection added under the Sonny Bono Copyright Term Extension Act are up this
year, so the list of public domain works is expanding again). But what if you
don’t have the original Anglo-Saxon Beowulf laying around?
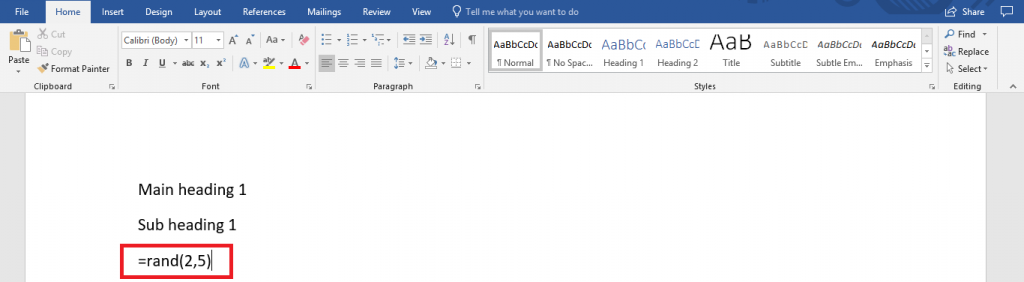
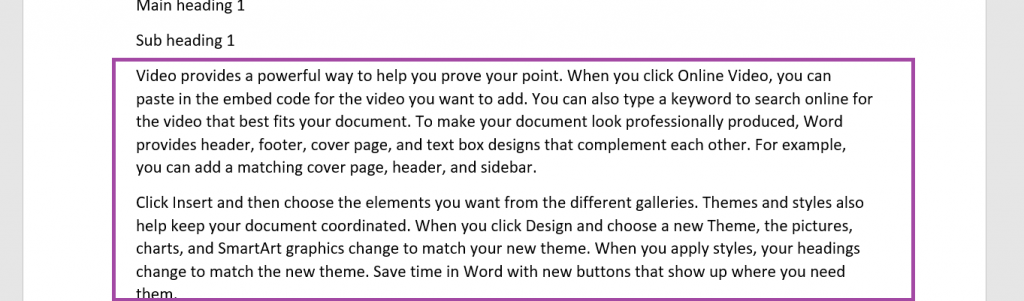
Microsoft Word has a rand() function too – type =rand(#Paragraphs,#Sentences)
The example here generates two paragraphs that are five
sentences each.
Hit enter – the formula is replaced with random text.
(This works in PowerPoint too). If you want some different text, try the lorem(#) function — the number in the parenthesis is the number of paragraphs — that uses the lorem ipsum paragraph as the content source.
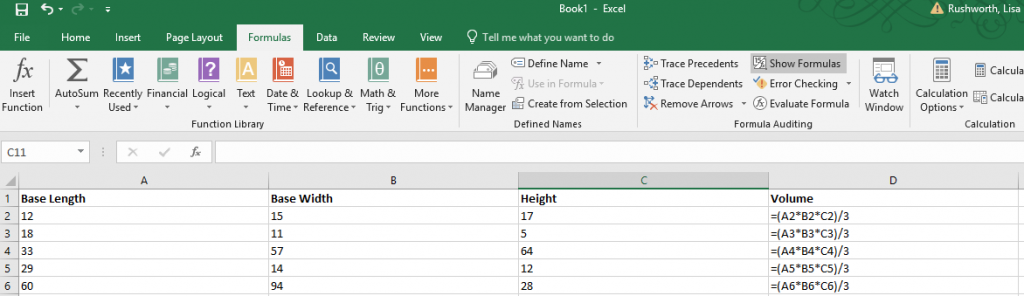
Formulae in Excel aren’t always easy to decode – even a
relatively simple formula, like the volume of a right rectangular pyramid below,
can be a little cryptic with the A2 type cell identifiers.
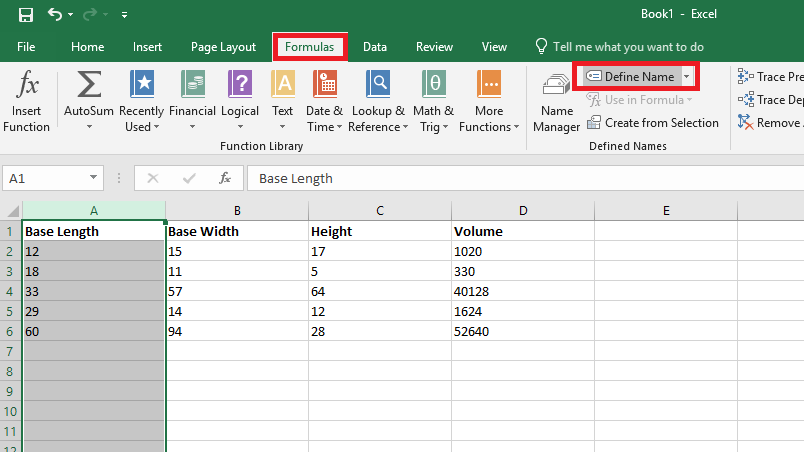
You can name ranges and use range names to make a formula easier to understand. Highlight a data set – in this case, I am highlighting the “length” values – column A. On the “Formulas” ribbon bar, click on “Define Name” (you don’t need to hit the inverted caret on the right of the button – just click the ‘define name’ text).
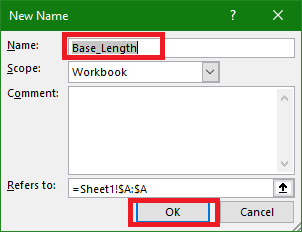
Supply a name for the range – in this case, I am calling it “Base_Length”
(range names need to start with a letter or underscore and cannot contain
spaces). Click OK to save the range name. Repeat this operation with all of the
other data groups – in my case, I named Column B “Base_Width” and Column C “Height”.
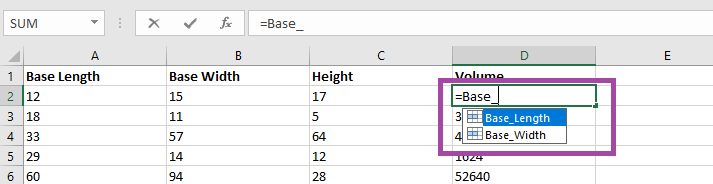
Use the name instead of the cell identifier – as you type
your formula, the range names matching your typed text will appear.
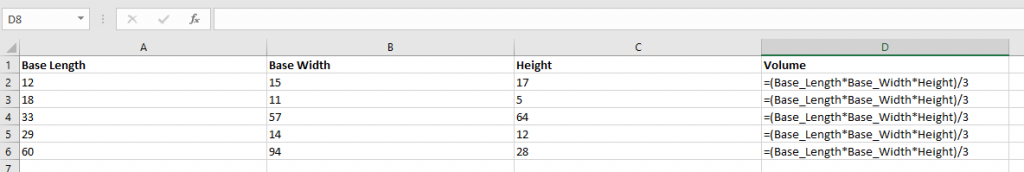
It is now a lot clearer
what this formula means – base length
times base width time height all divided by three. Which is the formula to calculate the volume of a right rectangular
pyramid.
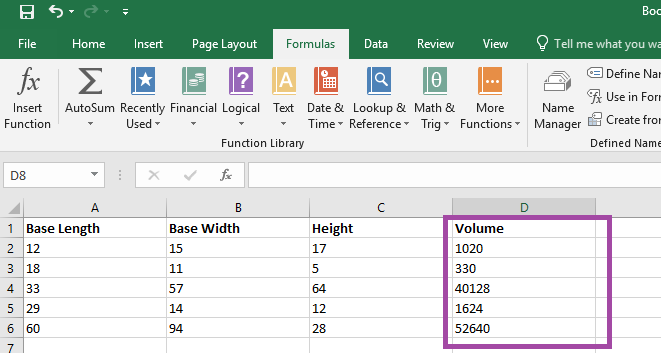
The calculated answer is the same either way – but this
makes it easier to figure out what exactly you were computing when you open the
spreadsheet again in six months 😊 (Or share the
spreadsheet with others).
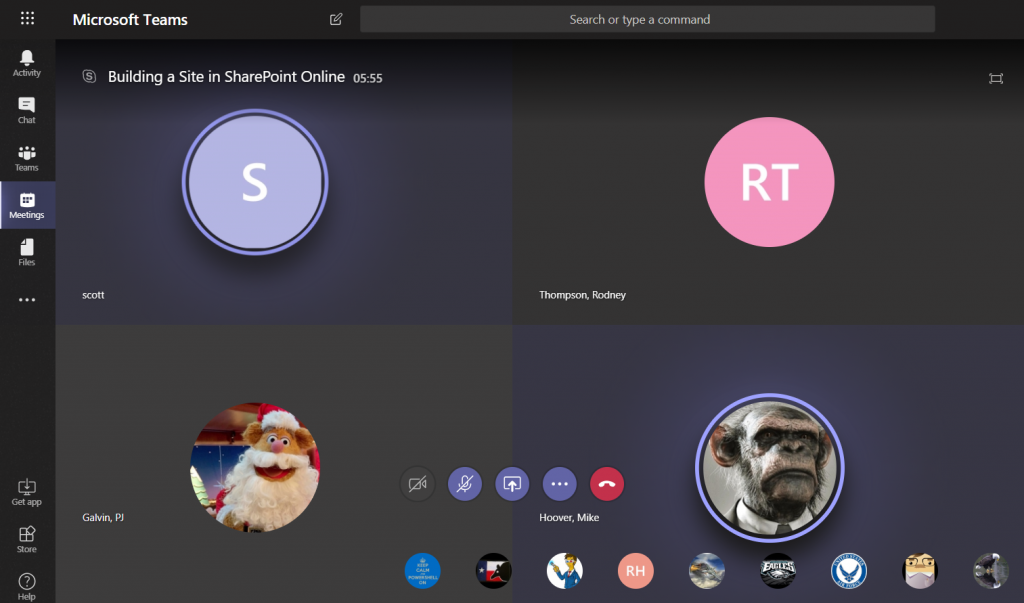
There are times when it is easy to tell who is speaking – there aren’t a lot of women in my group, so “the female voice” is usually me. My friend Richard is generally the only person with a New Zealand accent on any call (although someone who didn’t grow up in a Commonwealth country may have trouble distinguishing him from the guy from Australia). And after you work with someone for a while, you learn the voice and lexical nuances of colleagues. The rest of the time? I end up pausing the conversation to check who it was that volunteered to serve as my tester and clarify who is going to be getting back to me next week. In a Teams meeting, though, you can quickly tell who is speaking – and respond with a much friendlier “thanks, Jim, for offering to help”.
When you join a Teams meeting, you’ll see up to four large tiles
with meeting participants. If there are more than five participants (you don’t show
up on your own view!), the remaining people will be represented by smaller
images in the lower right-hand corner of the screen.
When someone is speaking, their tile will be highlighted in
a purply-blue and a brighter highlight circumscribes their image.
The four large tiles represent the most recent speakers, so
you will notice who is in these four tiles change throughout the call. And, yeah,
it’s possible for more than one person to be talking at a time – you’ll have
multiple highlighted tiles.
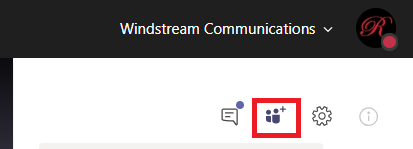
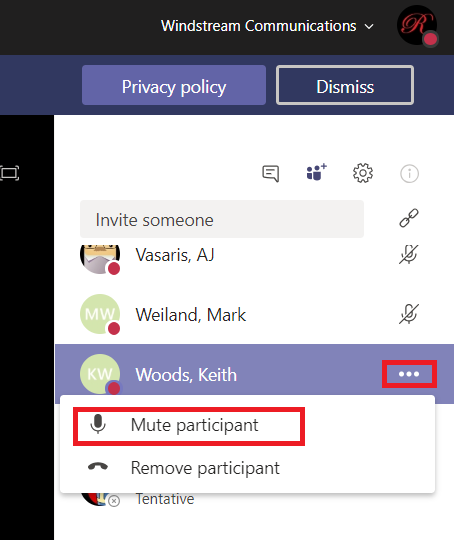
There is another place to view who is speaking. On the right-hand
column, click to enter the participant pane.
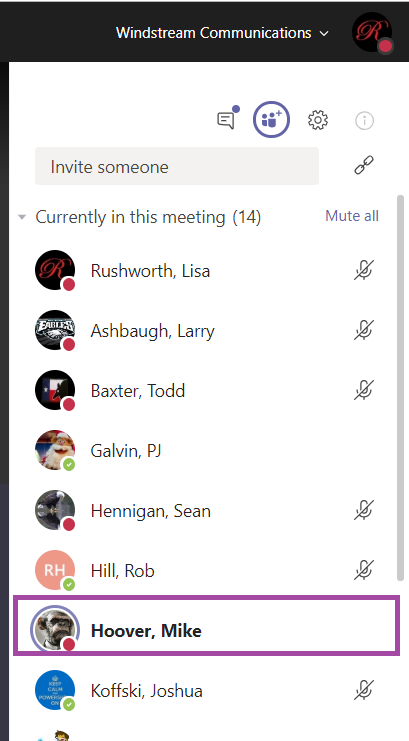
The current speaker will be bolded.
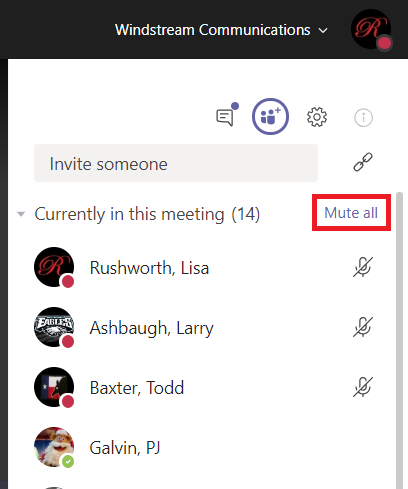
Bonus Features: Sometimes
I’ll start a large call and have trouble getting everyone’s attention to start the call. In the participant pane,
you can click “Mute all” to mute all
participants. N.B. Any participant can do this – so don’t test it in the
middle of a real discussion!
And just like meetings through the PSTN system or other web-meeting
platforms, you’ll get the occasional person typing without hitting mute. Or speaking
to someone who popped into their office. Or experiencing feedback on the connection.
In Teams, it’s easier to identify who
is causing a disruption – they are going to be highlighted as speaking.
Once you’ve identified the source of the noise, click the
not-quite-a-hamburger-button next to their name and select “Mute participant”.
Applications can generate data in formats that aren’t quite useful – glomming multiple fields
together to make something unusable. And asking people to type information can
yield inconsistent results – is my name Lisa Rushworth, Lisa J Rushworth, or
just Lisa? Excel has several functions that allow you to produce consistent,
usable data (without copy/pasting or deleting things!)
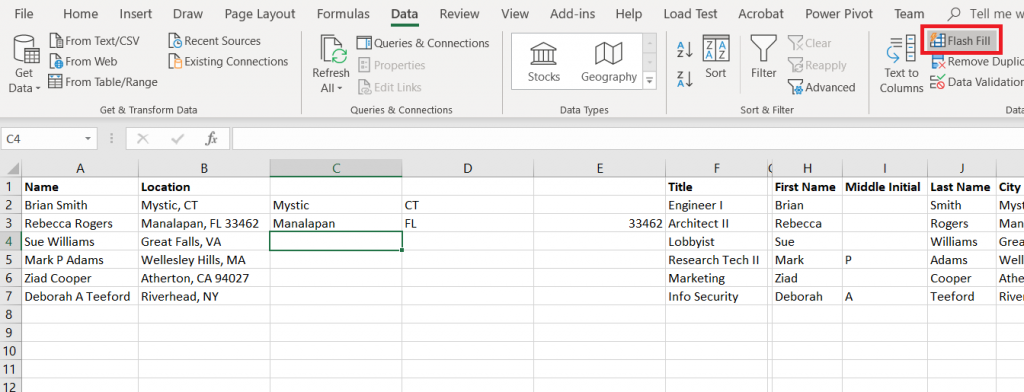
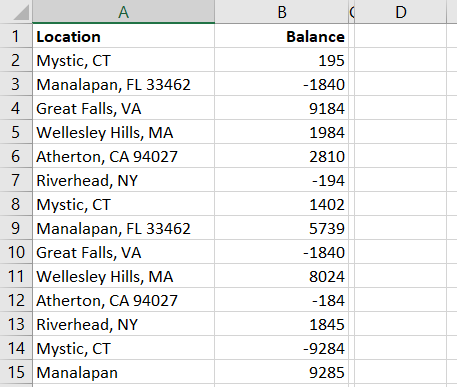
Flash Fill
Flash
Fill will try to figure it out for you. Add an empty column (or more) and manually
type one or two values. On the “Data” ribbon bar, select “Flash Fill” and Excel
will use the data you’ve entered into the row to figure out what should go in
the rest of the row.
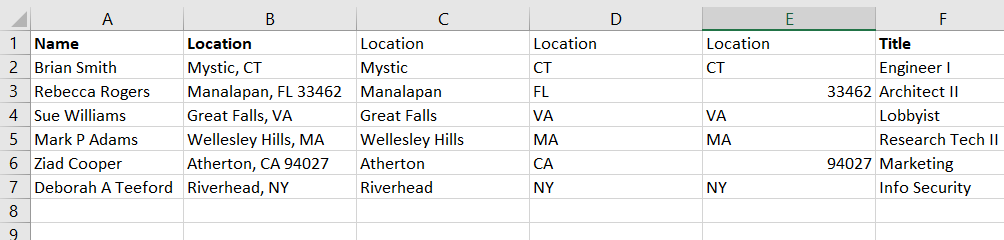
The guesses aren’t 100% accurate – especially if your
information is not consistent – but it’s a lot
easier to delete the handful of things that are obviously not zip codes …
Than to work out a formula that extracts the same
information
Text to columns
Text to columns uses the fixed-length file and delimited
file import wizard on a column of data – essentially treating that column as a
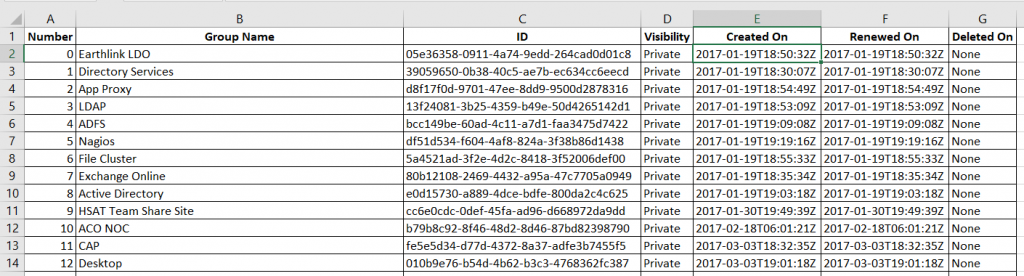
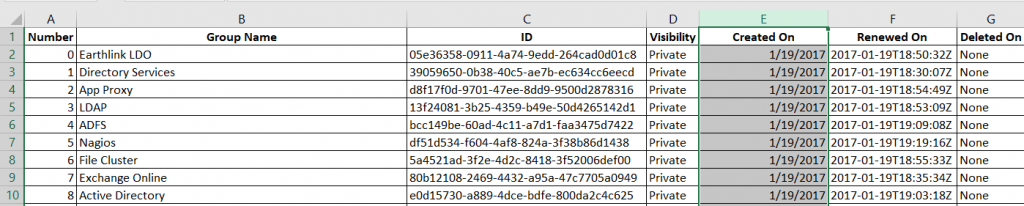
file to be imported. In this example, a DateTime value is provided in a way
that Excel only sees it as a string. And, frankly, I am not interested on the
exact hundredth of a second the event occurred. What I really want to do is group these creation dates by day, so all I
need is the date component.
If you want to retain all the data, you’ll need to insert empty
columns to the right – otherwise the data being split out can overwrite existing data. In my case, I only want to keep one of the new columns.
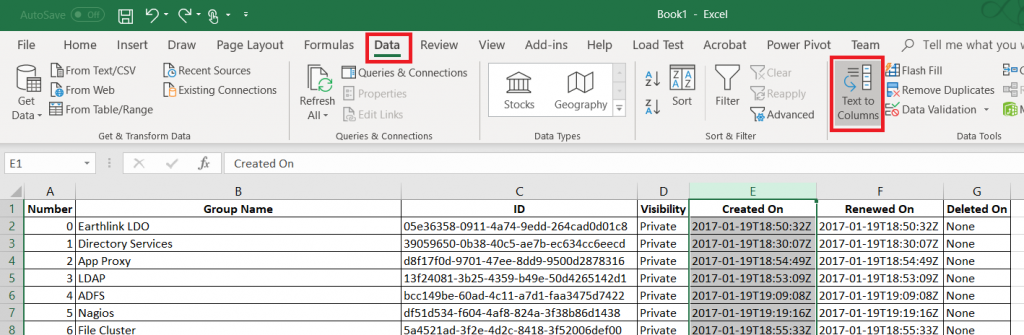
Highlight the column that holds your data. On the “Data”
ribbon, select “Text to columns”
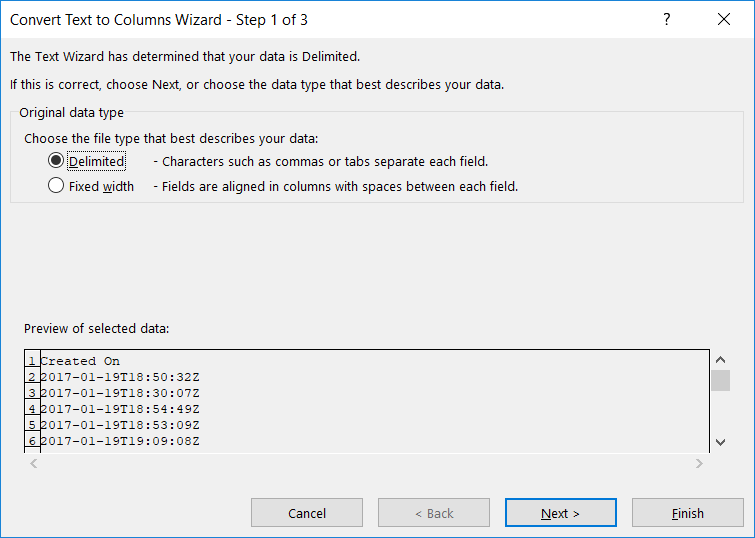
Select if the column should be split based on a fixed width
definition or a delimiter and click ‘Next’
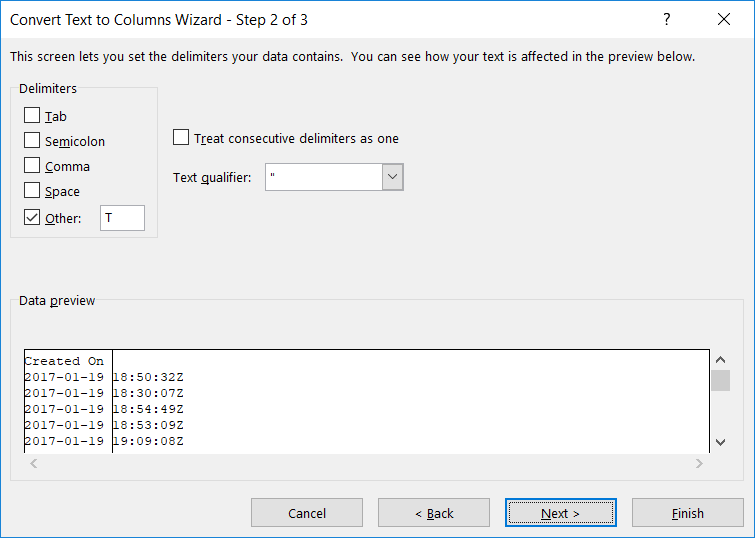
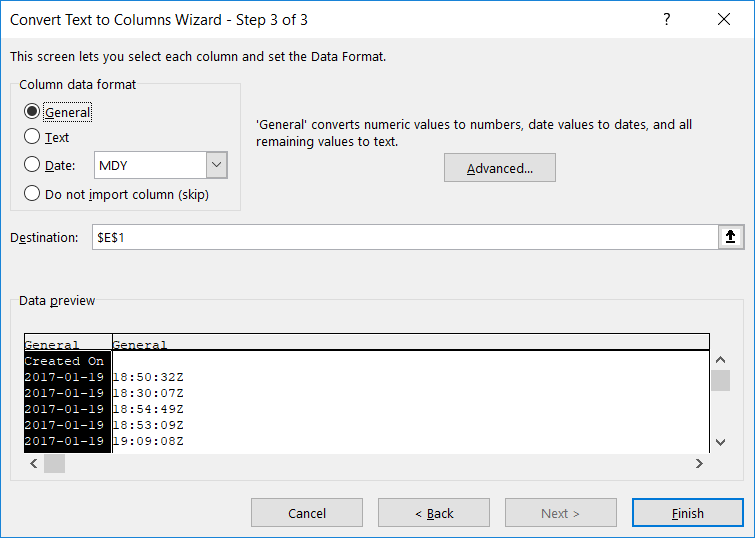
Indicate the proper delimiter – in this case, I need to use ‘Other’
and enter the letter T. A preview of the split data will appear below – make sure
it looks reasonable. Click “Next”.
For each new row, you can
specify a data type. Or leave the type set to “General” and Excel will try to
figure it out.
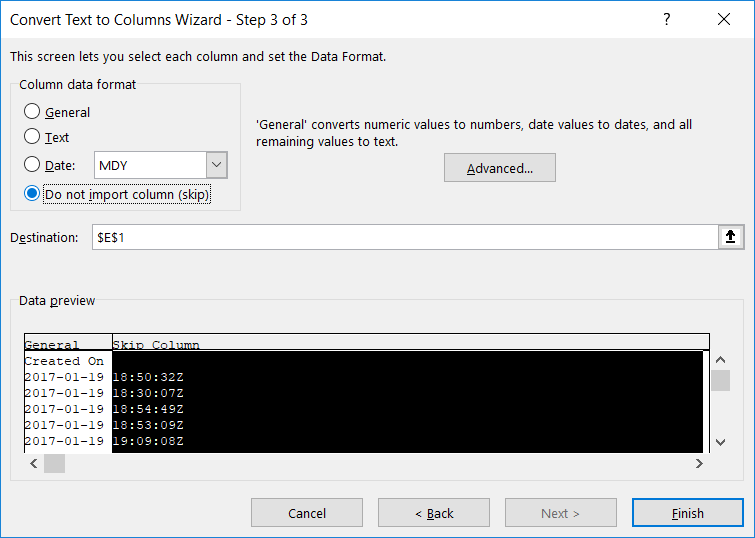
If you do not need to retain the data, select “Do not import
this column (skip)”. Click “Finish” to split your column.
Voilà – I’ve got a usable date value.
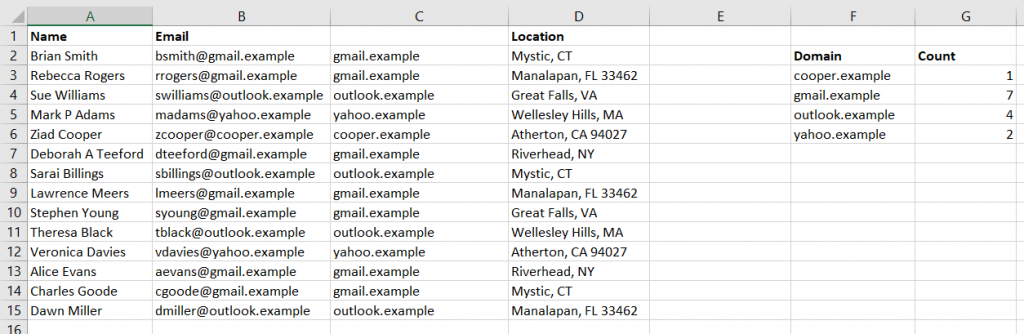
Notice, though, I have lost my original data. If you want to
retain the original data, create a
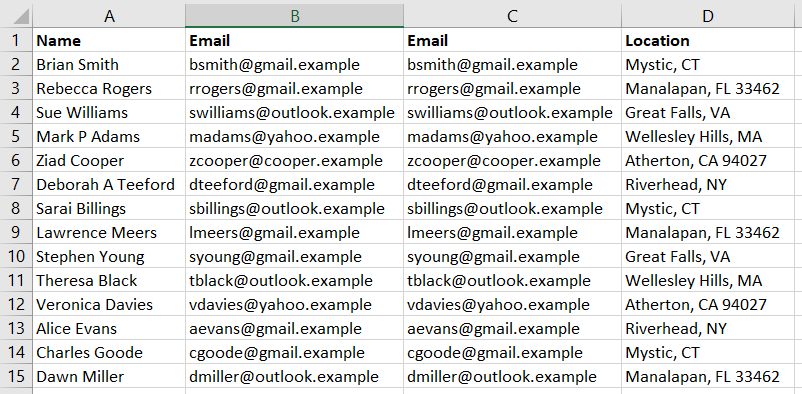
copy of the column. In this example, I want to know how many e-mail addresses
use each domain, but I want to have the e-mail addresses in a recognizable and
usable format too.
Text to columns will still replace the values from the selected column. But the copy will
contain the original text.
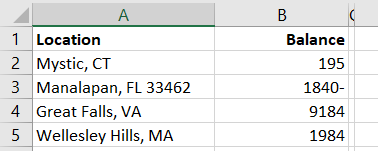
You can even use Text to columns to sort out odd data that doesn’t actually get split into multiple
columns. In this example, negative values have the minus sign after the number …
which isn’t actually a negative
number and isn’t usable in calculations.
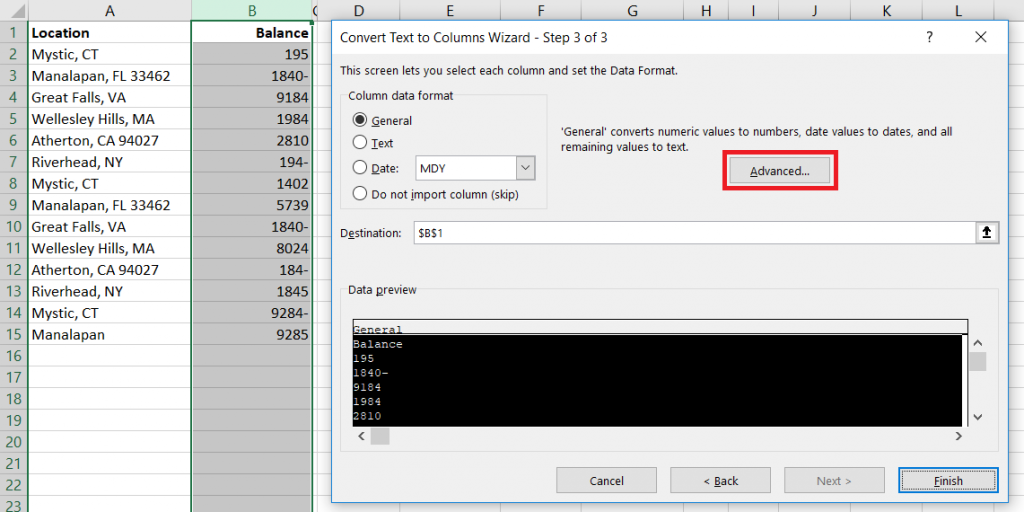
Pick a delimiter that doesn’t appear in your data, and you’ll
only have one column. When selecting the data format, click “Advanced”
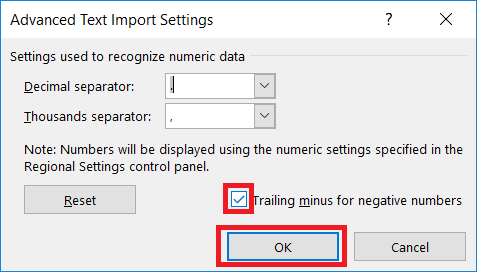
Make sure the “Trailing minus for negative numbers” checkbox
is checked and click OK.
And we’ve got negative
numbers
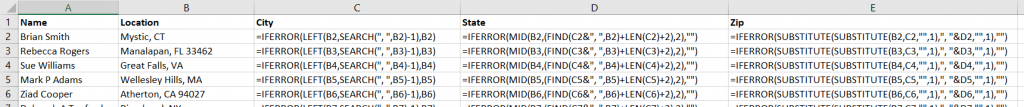
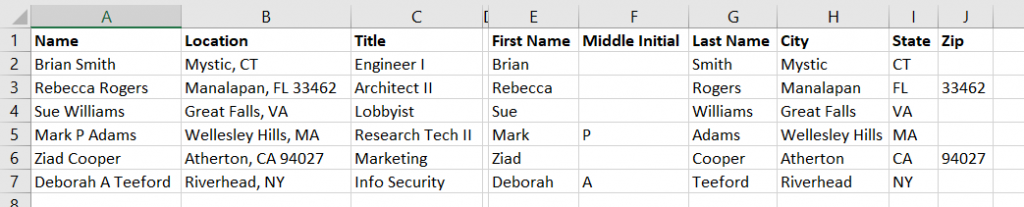
Right, Left, Mid, and Search Functions:
You can also use the Search
function in conjunction with Right,
Left,
and Mid
to extract components of column data. In this example, we have first and last
names. Since there are a few middle initials in there, we cannot just split on
the space character.
These formulae aren’t perfect – Mary Ann will have ‘Mary’ as
a first name – but
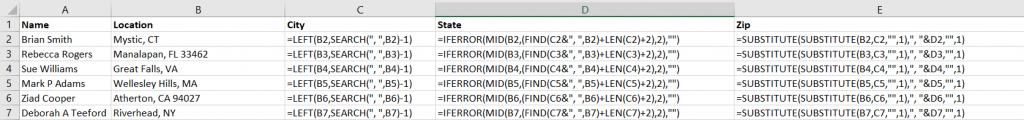
Working out where to start the text extraction and the number
of characters to extract can get complex. I’ll usually include the Substitute
function to simplify things a little – the zip code, in this case, is whatever
is left over after we find the city and state.
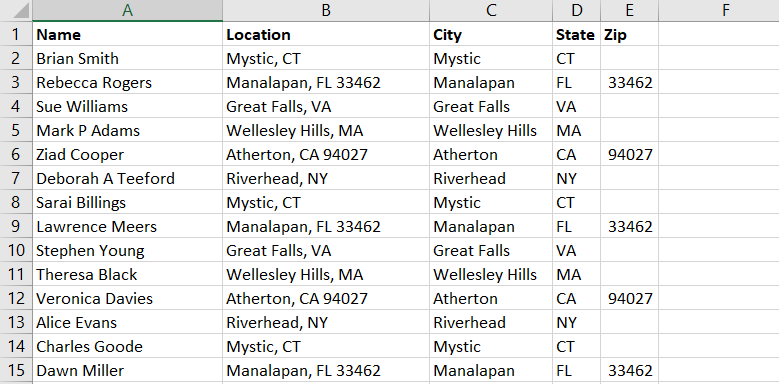
Producing columns with the city, state, and zip code from
the ‘Location’ column.
How many times have you clicked a second time expecting to “paint” your format only to realize the format painter is a one-click deal-e-o. Well, it’s not — you just have to know the trick to ‘locking’ it on. Double click the format painter button — now you can paint as many things with the format as you like.
If you want to create a simple bot that uses natural language processing training to allow users to ask questions that aren’t exactly what has been attached to the answer (i.e. I could say “I forgot my password”, “I don’t remember my password”, or “what’s my password” and be directed to the password portal URL without anyone having to come up with every possible iteration of the query),you can create one without actually programming a bot. You’ll need to enter some questions and answers – and it’s best to have a few questions associated with each answer so the bot can ‘learn’ what a real user might ask.
Before we start, understand how the billing works for Microsoft’s cloud services. There are generally free tiers for selections, but they are resource limited. When you first start with the Azure magic cloudy stuff, you get a 200$ credit. A message indicating your remaining credit is shown when you log into the Azure portal. Pay attention to that message – if you think you are using free tiers for everything but see your credit decreasing … you’ll need to investigate. Some features, like usage analytics,cost extra too.
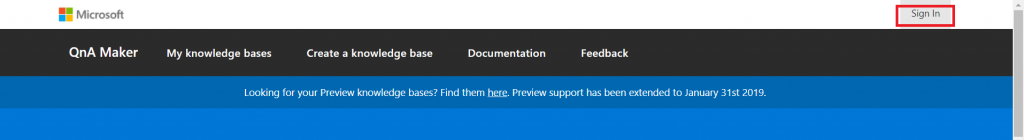
Instead of programming a bot, you can use a pre-built bot and a question/answer knowledgebase maintained at https://www.qnamaker.ai/ Sign in to your company account
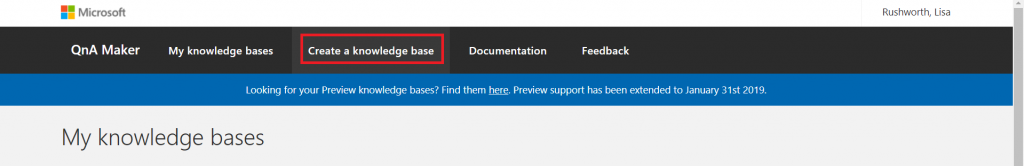
Select “Create a knowledge base” to start.
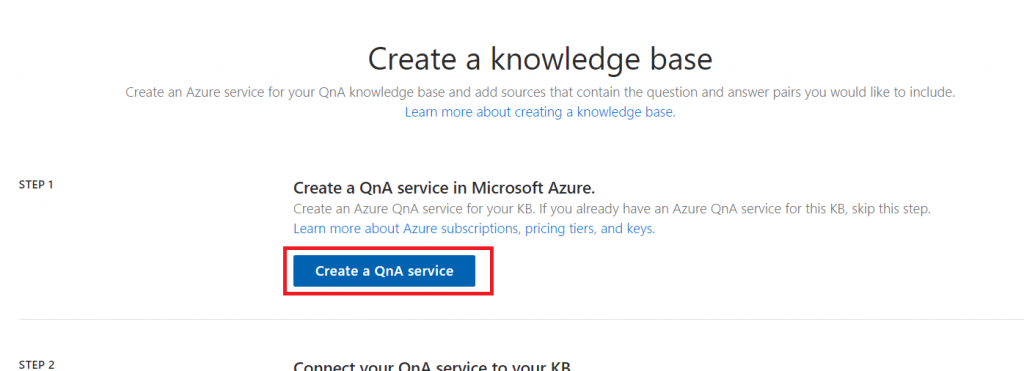
Click the button to “Create a QnA service”
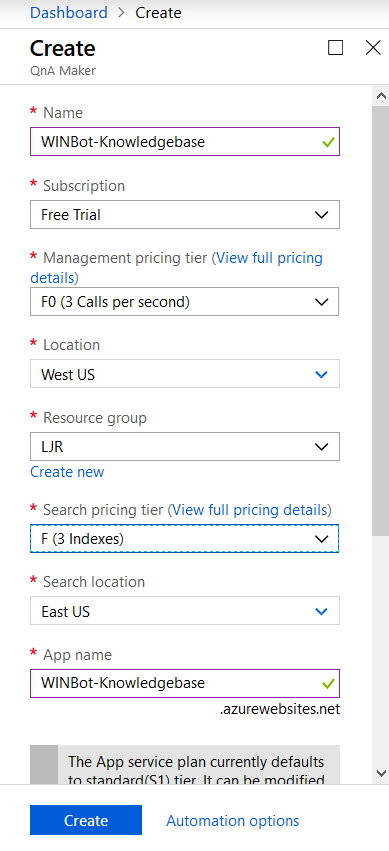
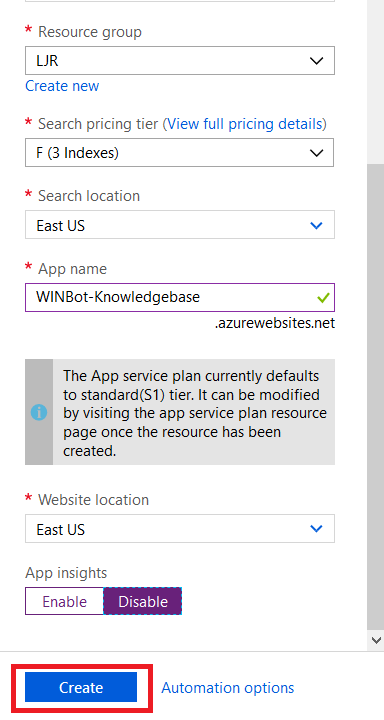
A tab will open to the Azure portal, and you’ll see a wizard to create a QnA Maker resource. Provide a name and select your subscription – you may be walked through creating a new trial subscription. For the management pricing tier and search pricing tier, select the free plans unless you expect high usage or need to store a lot of documents. The selections below are the free tiers.
Disable app insights unless you want to study usage of the q&a – app insights is a paid add-on. Click create to create.
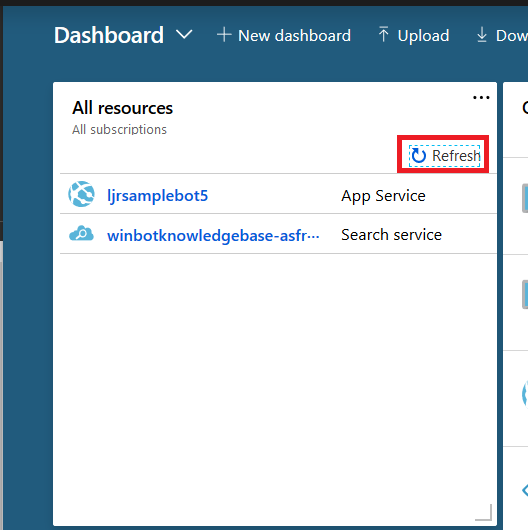
Return to the Azure Portal dashboard and click “Refresh” in the “All resources” section. Eventually, you will see your knowledge base appear.
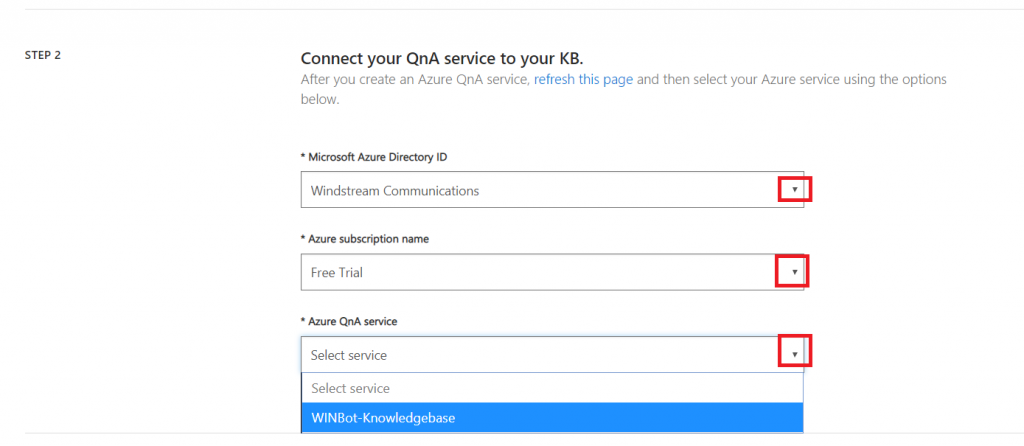
Return to the QnA Maker tab. In “Step 2”, click the drop-down arrows to select the Azure Directory (you should just see our company), the subscription (again, probably just the one), and the knowledge base we just created.
In “Step 3”, provide a name for your knowledge base. If you have an existing Q&A file, or a URL with Q&A pairs, you can import them here. I will enter question/answer pairs manually later.
Optionally, add ‘chit chat’ – this allows your bot to respond to common things users type like “do you know Siri” or “how are you”. It isn’t needed, but it saves adding answers to “are you there” manually. This imports question sets to your KB, so you can remove any you don’t feel are appropriate for your implementation.
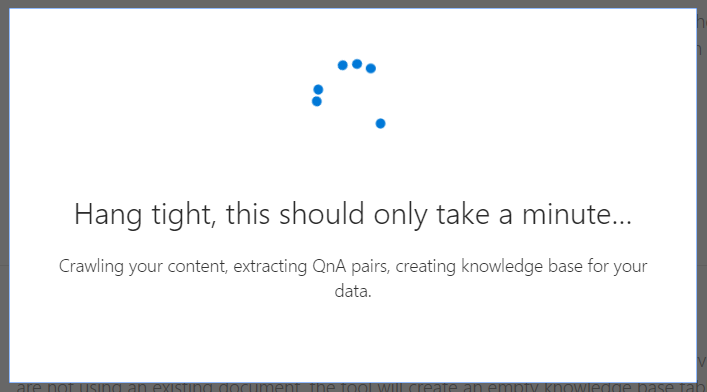
Click “Create your KB”.
And wait a few minutes.
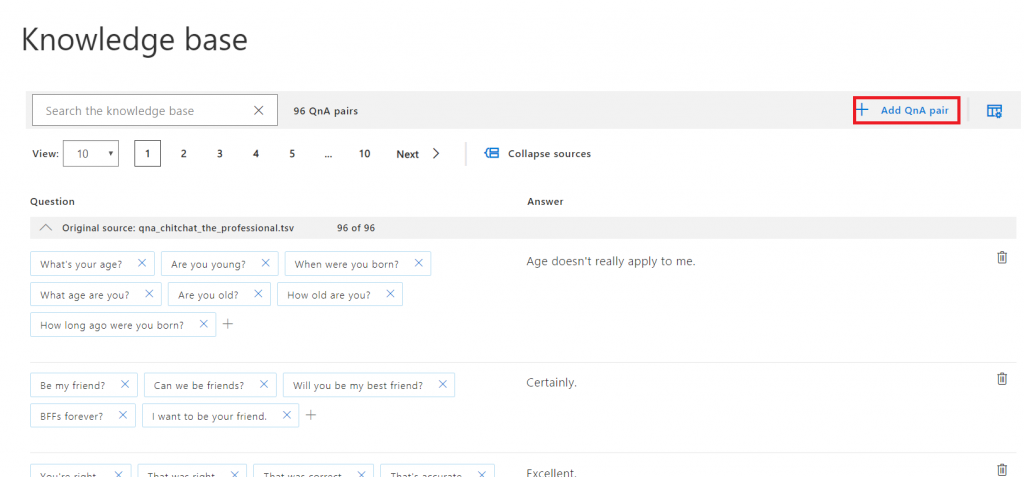
Once the KB has been created, click “Add QnA pair” to begin adding questions. You can also scroll through the imported “chit chat”questions and modify/remove any you don’t like.
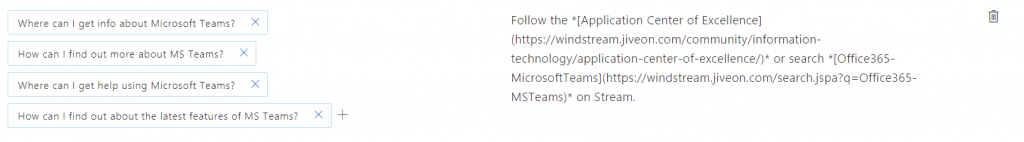
Answers use markdown formatting, so you can add hyperlinks, italics, bold, numbered lists.
Once you have added your question/answer pairs, click “Save and train” – training allows the bot to respond with an appropriate answer when the question isn’t exactly one of the questions provided.
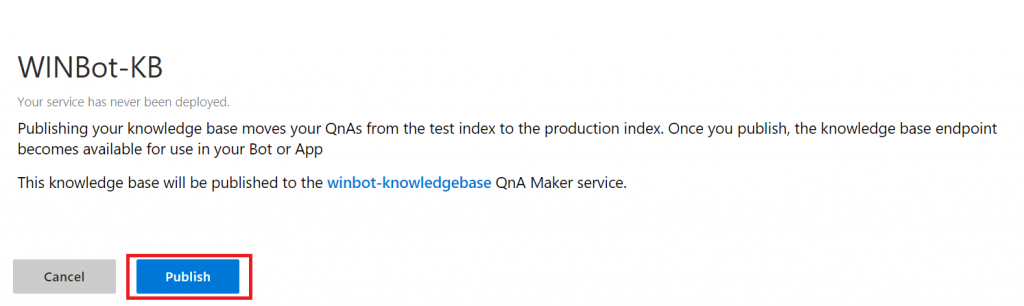
Wait again … when you are returned to the q&a pair screen, click “Publish” – this implements your changes in production. You can stage changes, allowing others to review them, by waiting to click Publish.
Read the warning – assuming you actually want your changes to be in production, click “Publish”.
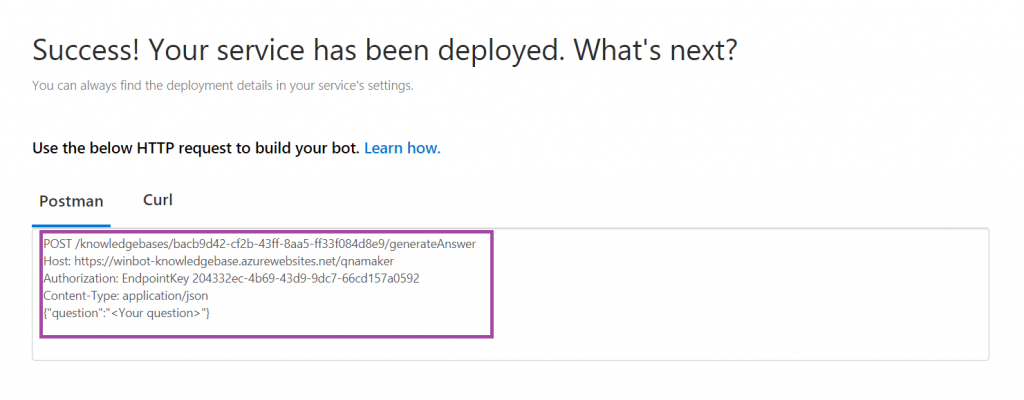
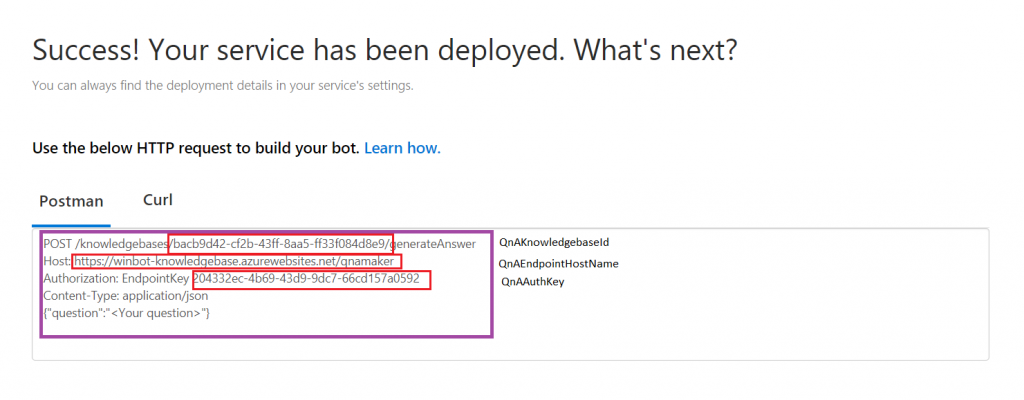
Wait some more, and you have an endpoint!
Copy the ‘stuff’ from the box into a text file somewhere. Find your QnAEndpointHostName, QnAKnowledgebaseId, and QnAAuthKey
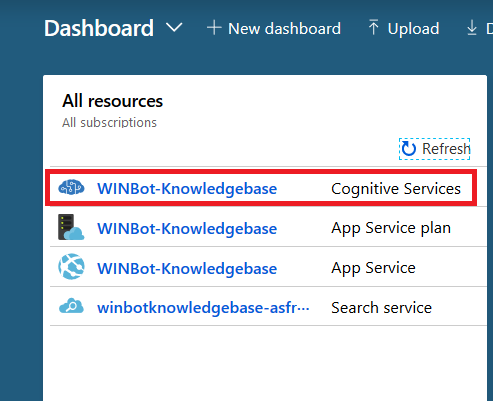
Unless you are going to be the *ONLY* person editing your KB (and never go on holiday, never ring up sick), you’ll want to share access with others. Log into https://portal.azure.com and locate your “cognitive service”. Click on its name to edit it.
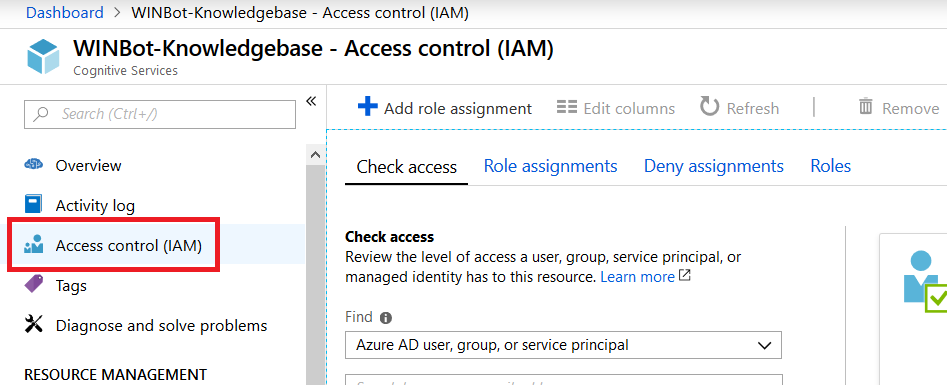
Click on “Access control (IAM)”
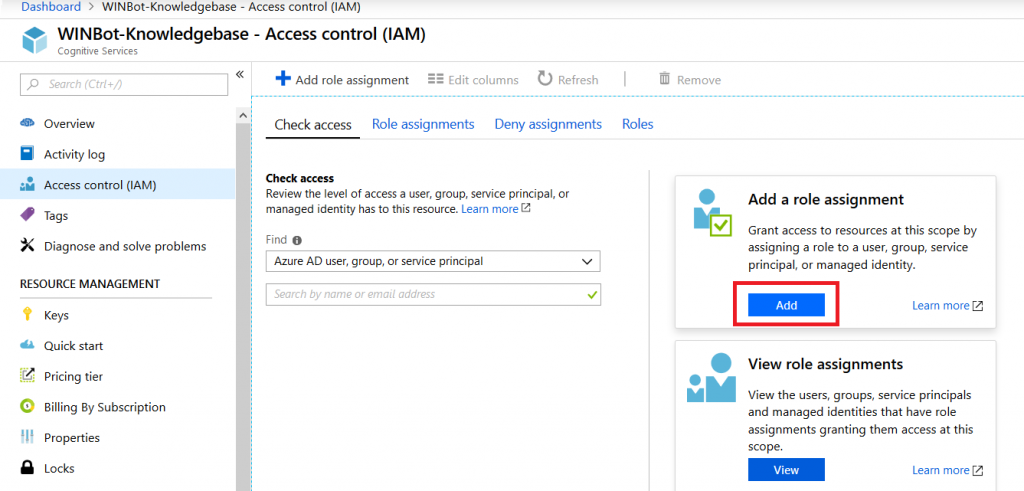
In the “Add a role assignment” section, click “Add”.
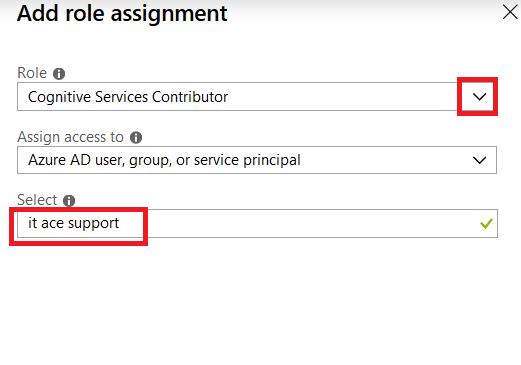
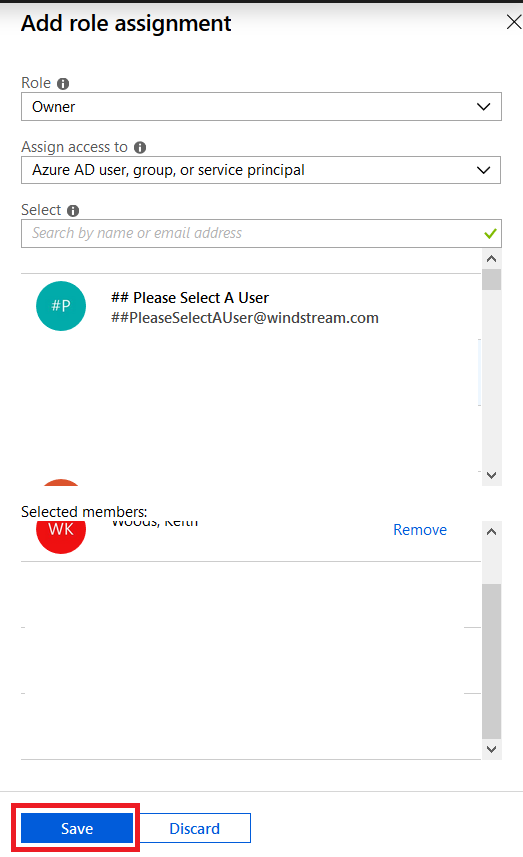
Select either “Cognitive Services Contributor” or “Owner” as the role (owners are allowed to manage all settings, including permissions whereas service contributors can only manage data within the knowledge base). Enter an Active Directory group name – you can enter individual people, but then someone will need to manually edit the permissions as people join and leave your group.
If you didn’t select owner, make sure you add some other owners (either a group or a few people)
Now we’re ready to set up a bot …
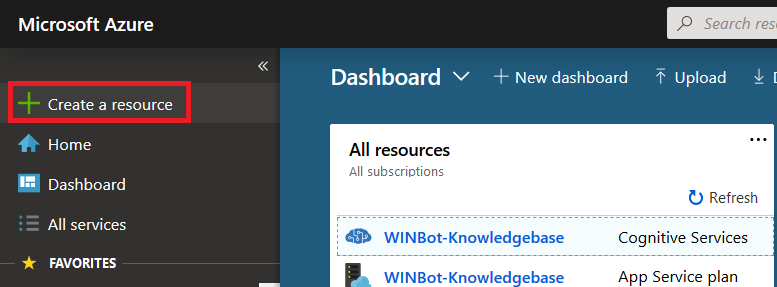
Microsoft Teams uses Azure bots – so you’ll need to create an Azure bot. From https://portal.azure.com, click on ‘Create a resource’.
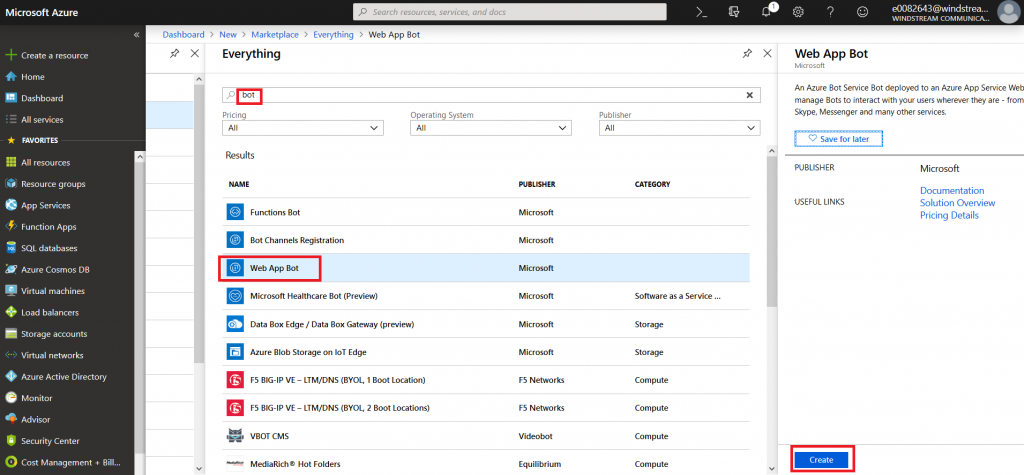
Search for “bot” and find the bots you are looking for. Either “Functions Bot’ and “Web App Bot” can be selected – I am using a WebApp bot because that’s what I’ve used for other bots I’ve coded. Functions bots use Azure functions, which are C# scripts, for logic processing; WebApp bots use WebAPIApp Service for logic processing (C# or NodeJS). If you’re not planning on tweaking anything … doesn’t much matter. Click “Create” to create the bot.
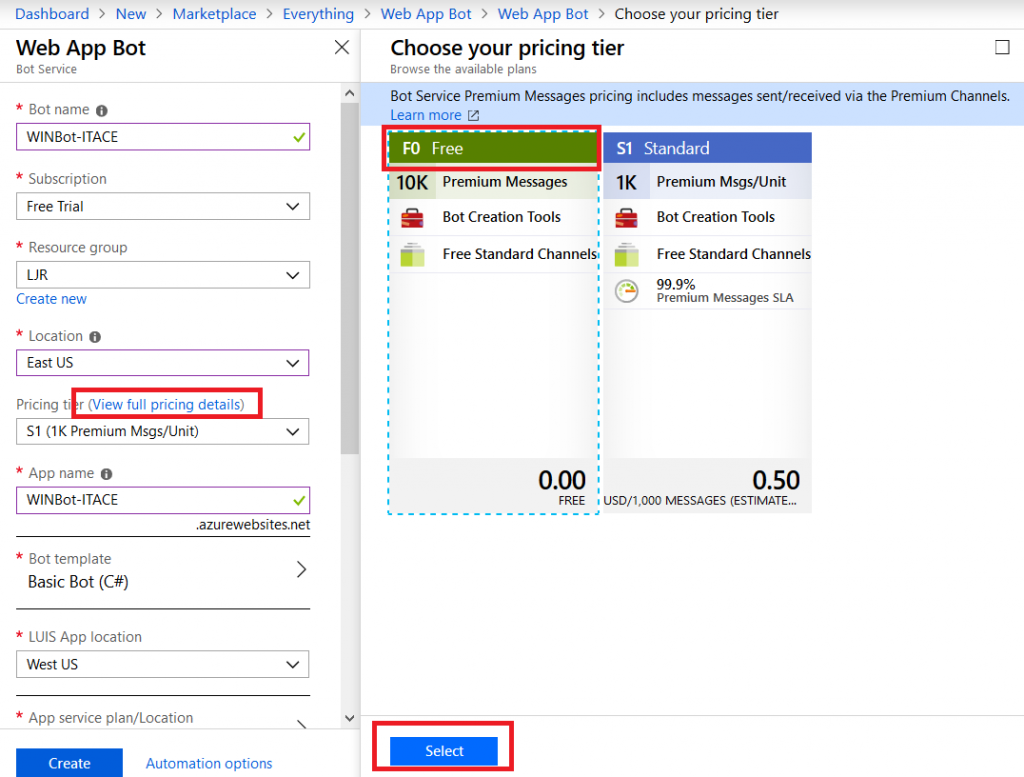
Give your bot a name – this needs to be unique. In the pricing tier, click on “View full pricing details” to see the options. Again, I am selecting the free tier. Don’t forget to hit ‘select’, or your selection will not be updated.
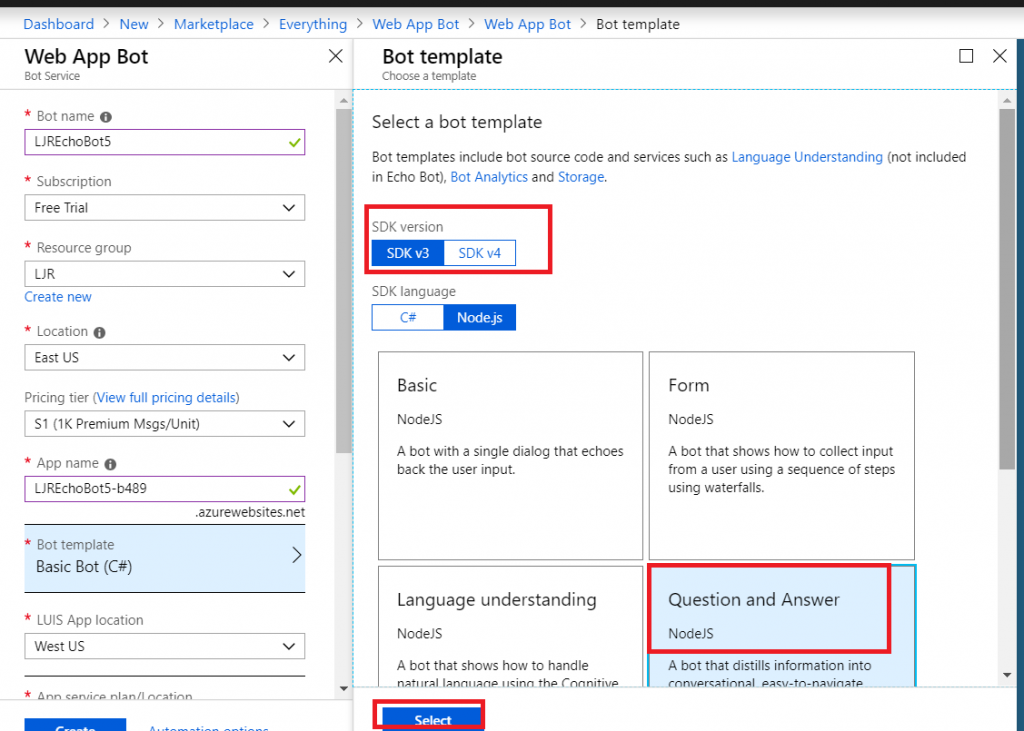
When you get to the bot template section, you can pick either C# or NodeJS – again, if you don’t plan on tweaking anything … doesn’t much matter. I am using C# because I know C#. Select the SDK v3, then find the “Question and Answer” bot template. Again, don’t forget to click “Select” or your selection won’t be saved.
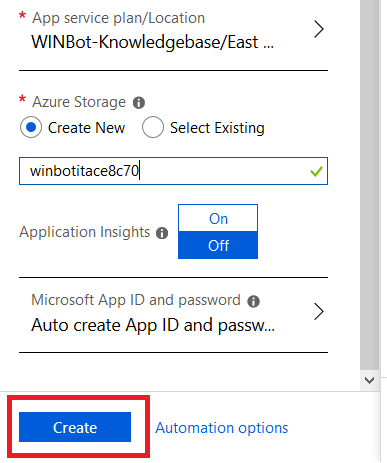
Create a new storage location, disable application insights (it’s a for-fee add-on), and click “Create”.
Wait for it …. You’ll see a blue bar running under the bell icon in the upper right-hand corner of the site.
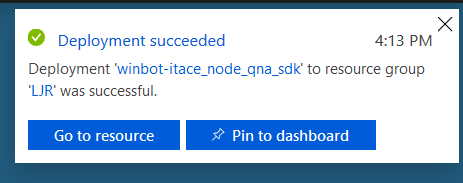
Soon, you’ll see a success message in the upper right-hand corner.
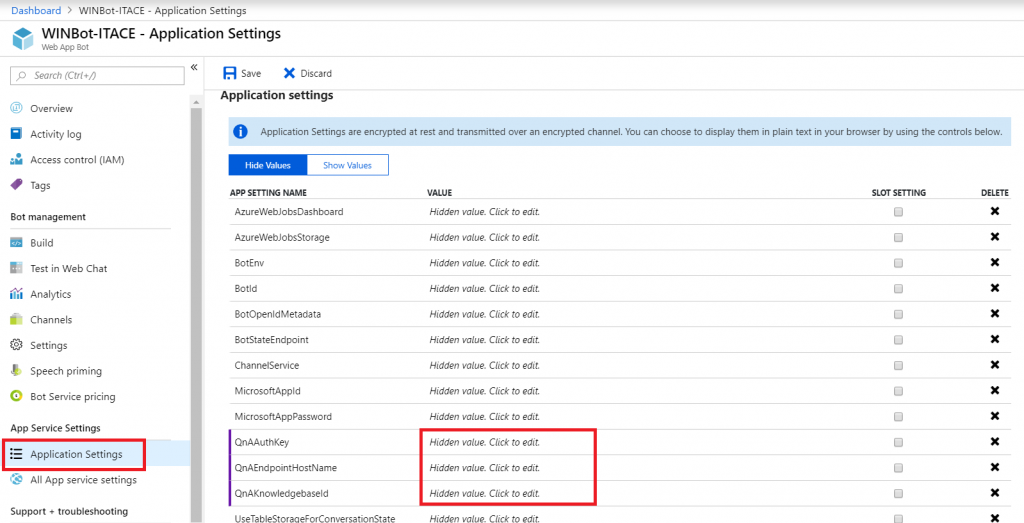
Refresh the resources on the dashboard and select the “WebApp Bot”. Under ‘App Service Settings’, go into “Application Settings”. Here’s where you enter the QnA information we saved after your knowledge base was published. Click in the “Value” column to paste in the values for QnAAuthKey, QnAEndpointHostname, and QnAKnowledgebaseId. Don’t have them? No big – go back to QnA Maker, open your KB, and select the “Settings” tab. There it is again!
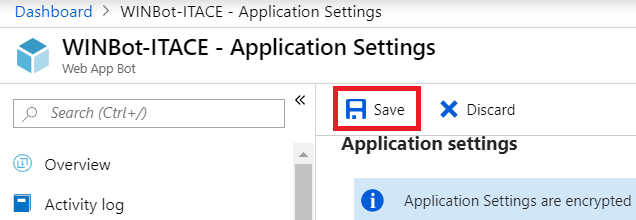
Click “Save” to commit your changes.
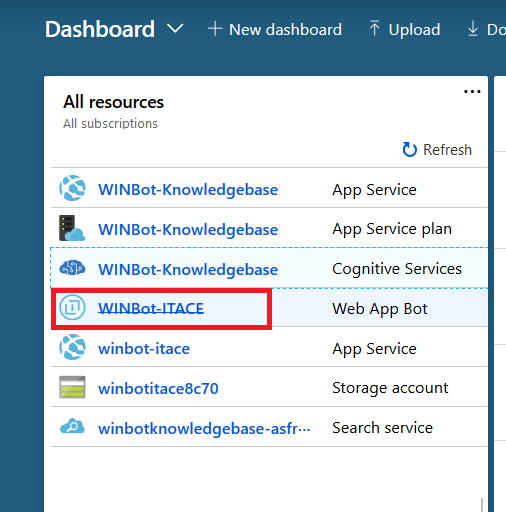
Return to the Dashboard and select your “Web App Bot”
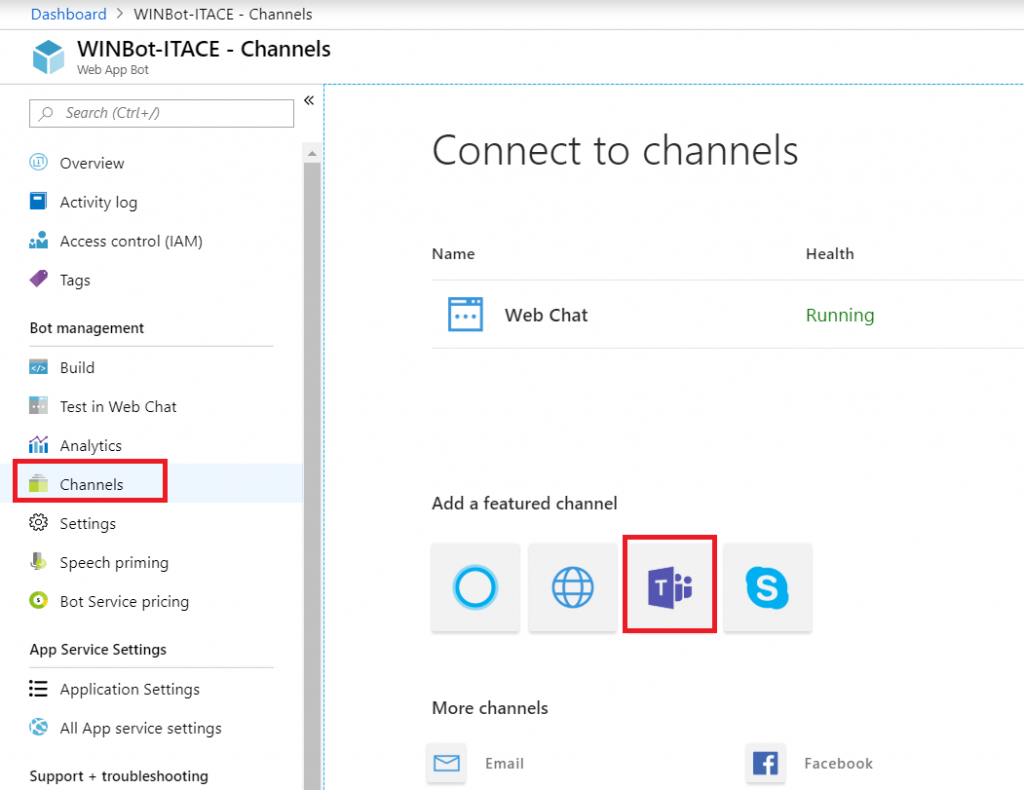
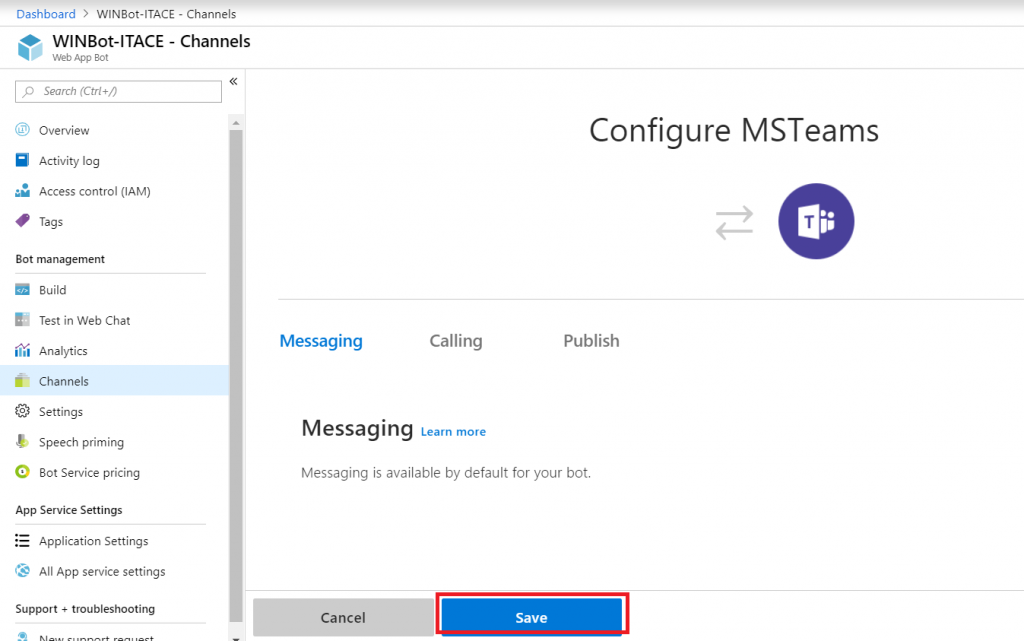
In the left-hand navigation column, select “Channels”. Click on the Teams logo.
The “Calling” tab will enable IVR or real-time media interaction with your bot – I have never done this, it may not be possible with our product set. “Publish” is to publish your Bot in the Microsoft store – not something I want to do with a bot designed to answer employee-specific questions, but I could see creating a Enterprise Customer Q&A bot that enterprise customers can add to their Teams spaces … in which case, making the bot available in the Microsoft Store would be convenient. Click “Save” to create a Teams channel for communication with your bot.
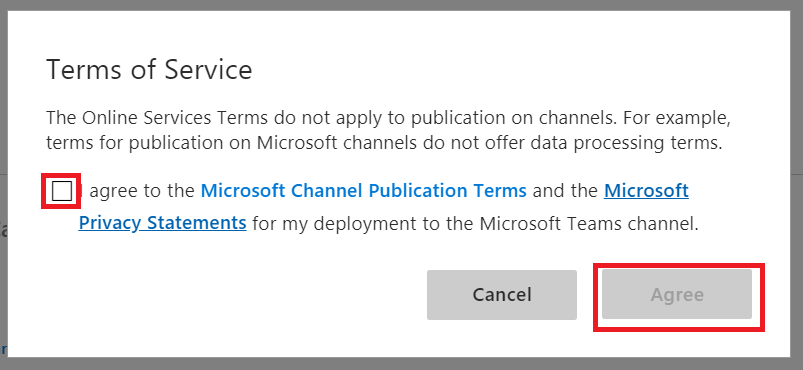
Read the publication terms and privacy statement. If you agree, check the box and click “Agree”.
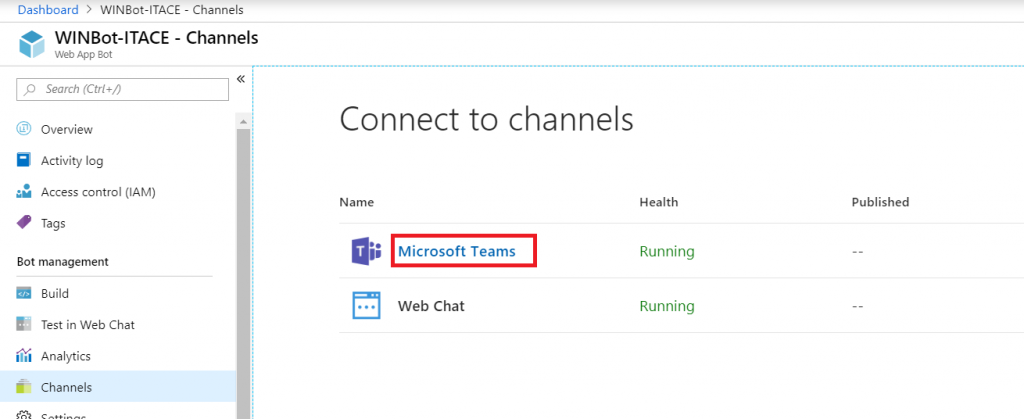
In the Channel section, click the “Microsoft Teams” hyperlink.
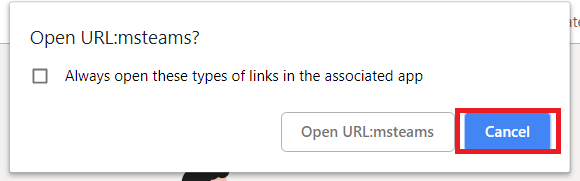
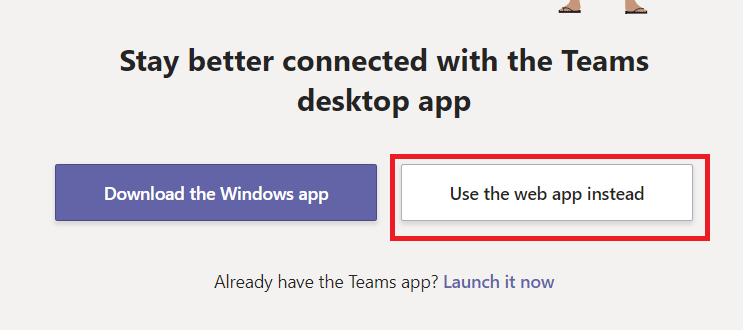
This will open a new browser tab. Click “Cancel” so you can copy the URL.
Once you’ve copied the URL, click “Open in Teams web app” to interact with your bot using the Teams web client (or ‘launch it now’ for Teams desktop client)
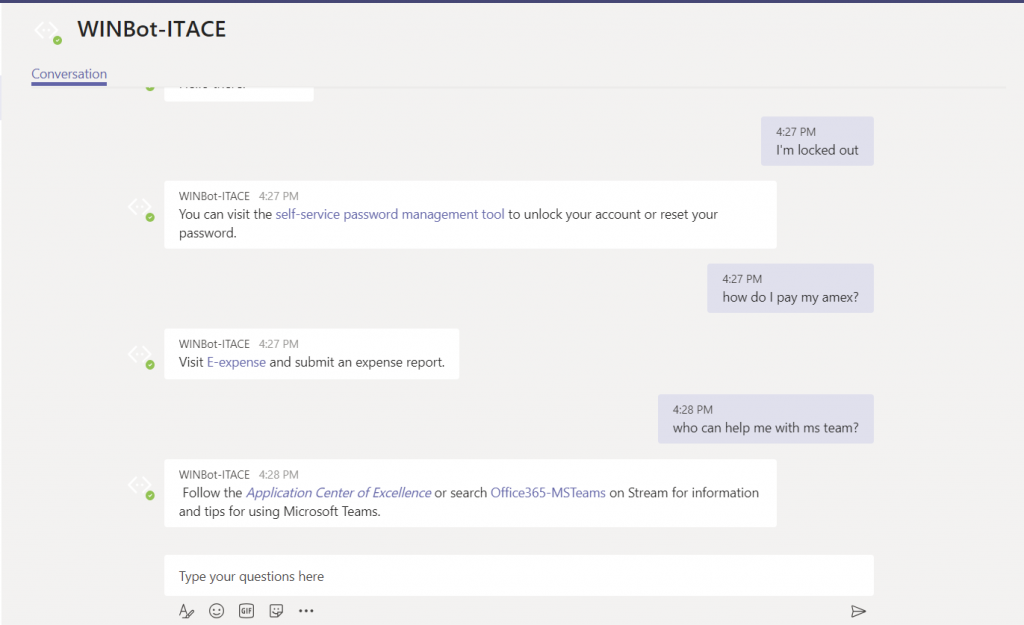
It’s alive! Ask some questions and verify that your answers are being delivered. Check for formatting problems or bad hyperlinks.
Anyone you have set as “Cognitive Service Maintainer” or“Owner” should be able to use QnA Maker to maintain the question and answer set. Log in to https://www.qnamaker.ai, select the “My knowledge bases” tab, and click on the knowledge base name. Modify/add question/answer pairs, then click “Save and train”, then “Publish”.
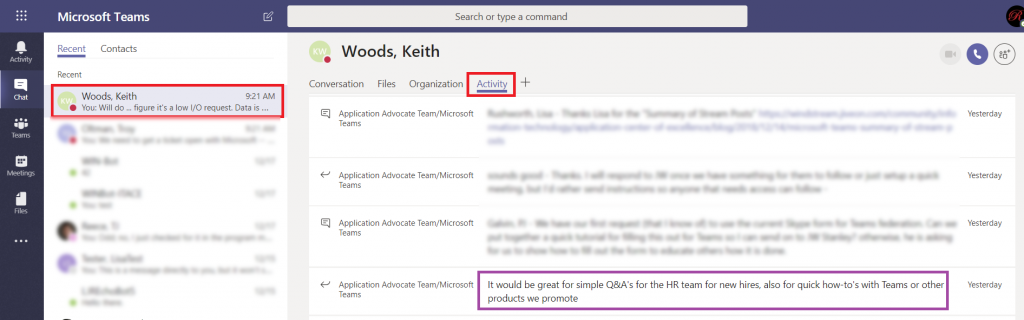
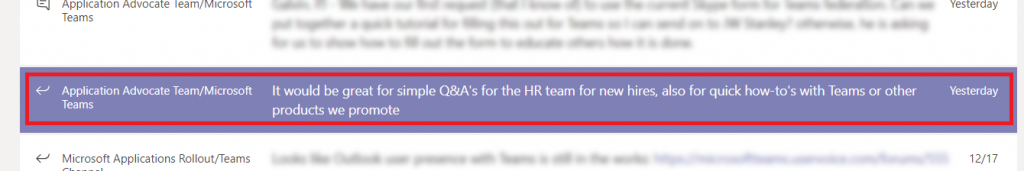
I am a member of multiple Teams, and I can remember that Keith posted something about creating a Q&A a few days ago … but I don’t remember where he posted that message. I cannot reply to it until I find it. Search can help — chat conversations are searchable. But did he type QnA, Q&A, Q and A …
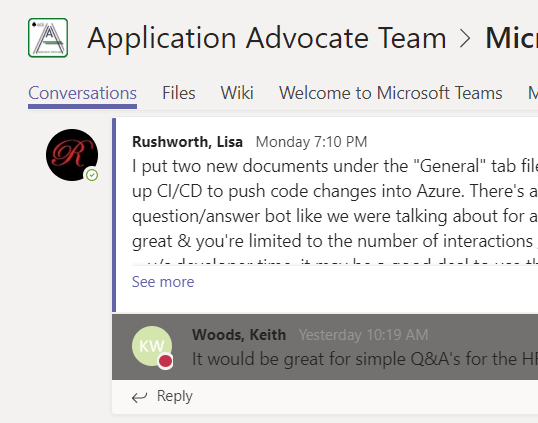
Instead of clicking through all of the channels in all of my Teams spaces trying to find a single post or working my way through the various ways of phrasing “questions and answers”, I can look at my chat with Keith. Click the “Activity” tab. Now I am looking at things Keith has posted to our shared Teams spaces in the past two weeks.
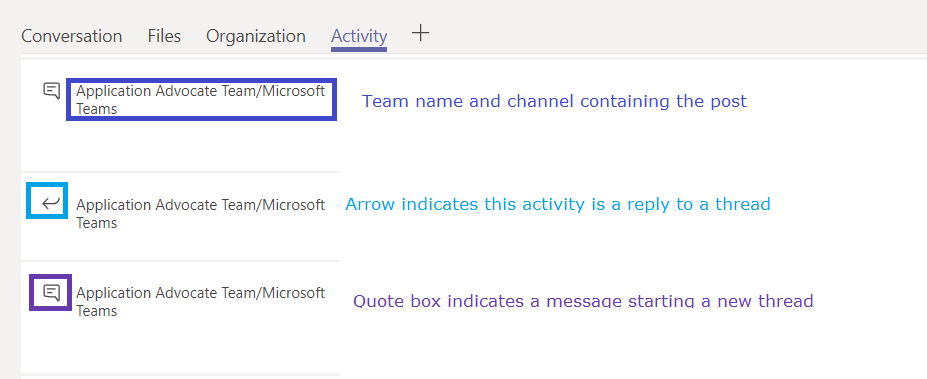
The Team and channel into which the activity was posted is included before each message. An icon indicates if the activity is a reply to an existing thread or a message starting a new thread.
You can click on any entry in the activity log.
Your Teams client will show you the message in its context – you are in the correct Team and Channel, and the message is briefly highlighted. This makes replying to the message we found in the activity feed quite quick.
What if you’ve never chatted with the person? Start a new chat and type in their name. You don’t have to send a message to them (although I could totally see myself writing “ignore this message – I just needed to get you listed in my recent conversations”), just click away and there will be a draft chat with them. Click on that draft chat, and you’ll have an “Activity” tab.