Month: November 2024

AD passwordLastSet Times

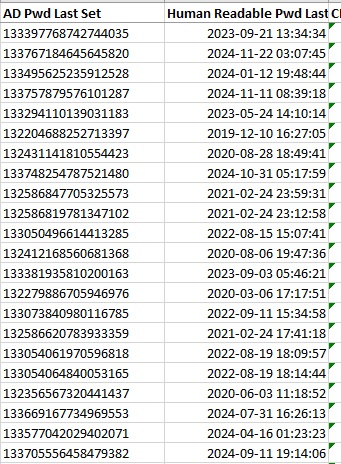
I’m doing “stuff” in AD again, and have again come across Microsoft’s wild “nanoseconds elapsed since 1601” reference time. AKA “Windows file time”. In previous experience, I was just looking to calculate deltas (how long since that password was set) so figuring out now, subtracting then, and converting nanoseconds elapsed into something a little less specific (days, for example) was fine. Today, though, I need to display a human readable date and time in Excel. Excel, which has its own peculiar way of storing date time values. Fortunately, I happened across a formula that works

=((C2-116444736000000000)/864000000000)+DATE(1970,1,1)

Voila!

Quick sed For Sanitizing Config Files

When sending configuration files to other people for reference, I like to redact any credential-type information … endpoints that allow you to post data without creds, auth configs, etc. Sometimes I replace the string with REDACTED and sometimes I just drop the line completely.

Make a copy of the config files elsewhere, then run sed


# Retain parameter but replace value with REDACTED
sed -i 's|http_post_url: "https://.*"|post_url: "REDACTED"|' *.yaml

# Remove line from config
sed -i '/authorization: Basic/d' *.yaml

QR Code Generation

I put together a quick program that creates a “fancy” QR code to a specified URL with the specified color and drops the desired “logo” file into the center of the code.

import qrcode
from PIL import Image

def generate_qr_code_with_custom_color_and_logo():
    url = input("Please enter the URL for which you want to generate a QR code: ")

    rgb_input = input("Please enter the RGB values for the QR code color (e.g. 0,0,0 for black): ")
    
    try:
        rgb_color = tuple(map(int, rgb_input.split(',')))
        if len(rgb_color) != 3 or not all(0 <= n <= 255 for n in rgb_color):
            raise ValueError("Invalid RGB color value.")
    except Exception:
        print("Error parsing RGB values. Please make sure to enter three integers separated by commas.")
        return

    qr = qrcode.QRCode(
        version=1,  # controls the size of the QR Code
        error_correction=qrcode.constants.ERROR_CORRECT_H,  # high error correction for image insertion
        box_size=10,
        border=4,
    )
    qr.add_data(url)
    qr.make(fit=True)

    # Generate the QR code with the specified RGB color
    img = qr.make_image(fill_color=rgb_color, back_color="white")

    # Load the logo image
    logo_image_path = input("Please enter the logo for the center of this QR code: ")

    try:
        logo = Image.open(logo_image_path)
    except FileNotFoundError:
        print(f"Logo image file '{logo_image_path}' not found. Proceeding without a logo.")
        img.save("qr_code_with_custom_color.png")
        print("QR code has been generated and saved as 'qr_code_with_custom_color.png'.")
        return

    # Resize the logo image to fit in the QR code
    img_width, img_height = img.size
    logo_size = int(img_width * 0.2)  # The logo will take up 20% of the QR code width
    logo = logo.resize((logo_size, logo_size), Image.ANTIALIAS)

    position = ((img_width - logo_size) // 2, (img_height - logo_size) // 2)

    img.paste(logo, position, mask=logo.convert("RGBA"))

    img.save("qr_code_with_custom_color_and_logo.png")

    print("QR code with a custom color and a logo image has been generated and saved as 'qr_code_with_custom_color_and_logo.png'.")

if __name__ == "__main__":
    generate_qr_code_with_custom_color_and_logo()

Voila!

Outlook Web Joyful Animations

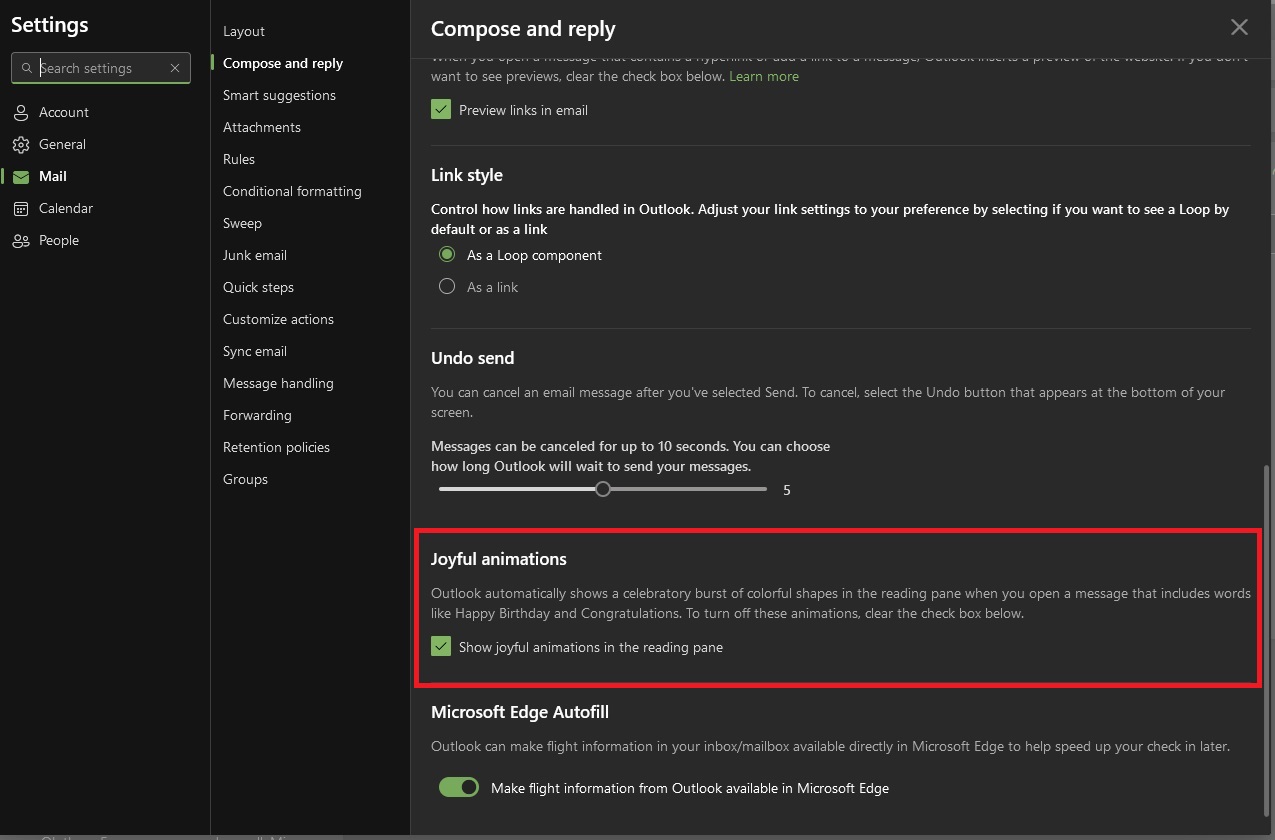
I have gotten a few messages at work where it seems like someone went through extra effort to highlight the word “congratulations” and set a onMouseOver trigger that throws digital confetti.

After a while, I wondered how people did that. What other animations can you trigger? And it turns out the answer is … they didn’t! Microsoft has a setting called “Joyful Animations” that identifies a few phrases within messages you receive and sets these triggers.

JavaScript: Extracting Web Content You Cannot Copy

There are many times I need to copy “stuff” from a website that is structured in such a way that simply copy/pasting the table data is impossible. Screen prints work, but I usually want the table of data in Excel so I can add notations and such. In these cases, running JavaScript from the browser’s developers console lets you access the underlying text elements.

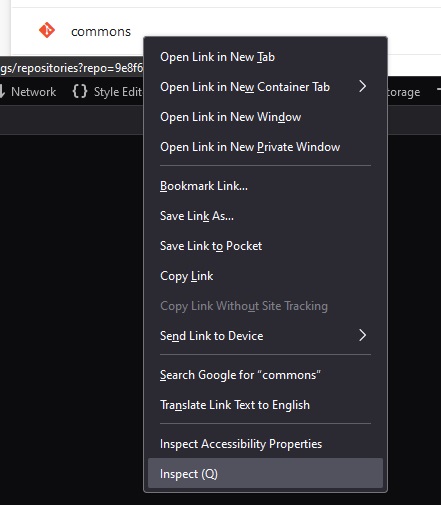
Right click on one of the text elements and select “Inspect”

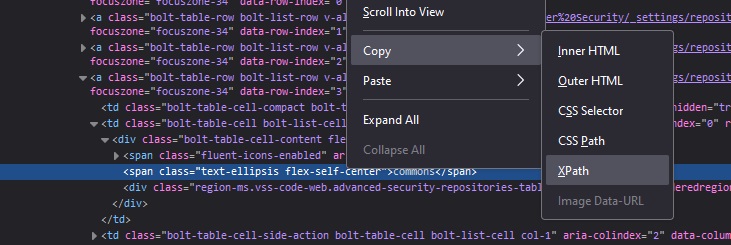
Now copy the element’s XPath

Read the value — we don’t generally want just this one element … but the path down to the “tbody” tag looks like a reasonable place to find the values within the table.

/html/body/div[1]/div/div/div[2]/div[2]/div[2]/div/div[3]/div/div/div[3]/div/div/div/table/tbody/a[4]/td[2]/div/span[2]

Use JavaScript to grab all of the TD elements under the tbody:

// Define the XPath expression to select all <td> elements within the specific <tbody>
const xpathExpression = "/html/body/div[1]/div/div/div[2]/div[2]/div[2]/div/div[3]/div/div/div[3]/div/div/div/table/tbody//td";

// Use document.evaluate to get all matching <td> nodes
const nodesSnapshot = document.evaluate(xpathExpression, document, null, XPathResult.ORDERED_NODE_SNAPSHOT_TYPE, null);

// Log the number of nodes found (for debugging purposes)
console.log("Total <td> elements found:", nodesSnapshot.snapshotLength);

// Iterate over the nodes and log their text content
for (let i = 0; i < nodesSnapshot.snapshotLength; i++) {
    let node = nodesSnapshot.snapshotItem(i);
    if (node) {
        const textContent = node.textContent.trim();
        if (textContent) { // Only log non-empty content
            console.log(textContent);
        }
    }
}

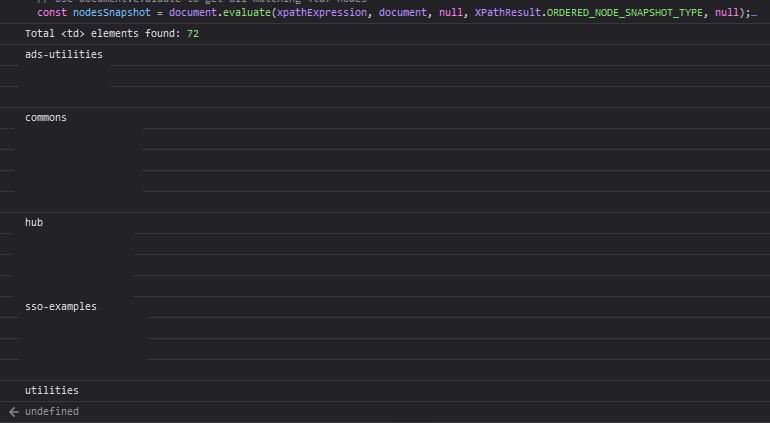
Voila! I redacted some data below, but it’s just a list of values, one per line.

Bullet Ballots

We’ve seen posts from a few people questioning the integrity of the election results. Some are vague — the fact that Republican operatives were able to copy data from voting machines and then spend a few years possibly looking at how to exploit them is certainly a valid concern, but there’s not data available to prove or dispute this. One, however, has analysis of votes cast. https://substack.com/inbox/post/151721941 from Stephen Spoonamore.

So I started pulling numbers — drop-off votes, I presume, are where the presidential candidate far outperformed down-ballot same-party candidates. That seems … plausible. A high number of “bullet ballots”, however, could be worrisome. And that, it seems, could be constructed from public data. How many people voted for president? How many voted for a Senator? Now, this doesn’t work if the state didn’t have a Senate election. (NC had a governor race, so I’m including that as well). I’m sure some people show up to vote for the top and are done. Spoonamore even says this happens – they’ve got stats for previous elections.

Do the number of people who voted for someone as the president v/s the number of people who voted for someone for senate fall outside a reasonable range?

State  Senate – Repub   Senate – Dem   Senate – Total   Pres – Repub   Pres – Dem   Pres – Total   %R   %D   %Tot   Pres Party   Notes 
NJ                 1,767,773             2,151,322              4,015,343           1,966,571          2,218,074            4,268,422 10.109% 3.009% 5.93% D 86% reporting senate, 91% reporting pres
RI                    195,919                 293,288                 489,207               214,406              285,156                510,749 8.622% -2.852% 4.22% D
IN                 1,659,416             1,097,061              2,829,710           1,720,347          1,163,587            2,933,684 3.542% 5.717% 3.54% R
CA                 6,303,942             9,026,904           15,330,846           6,072,371          9,266,468          15,842,804 -3.814% 2.585% 3.23% D
CT                    679,799             1,002,049              1,711,215               739,638              994,549            1,763,712 8.090% -0.754% 2.98% D
OH                 2,812,778             2,599,761              5,602,804           3,180,116          2,533,699            5,765,017 11.551% -2.607% 2.81% R
NY                 3,155,521             4,491,802              7,686,522           3,484,126          4,413,632            7,897,758 9.431% -1.771% 2.67% D
ME                    277,873                   84,819                 799,861               372,323              431,915                821,382 25.368% 80.362% 2.62% D Independent won Senate race
WA                 1,549,187             2,252,578              3,801,765           1,530,924          2,245,849            3,898,837 -1.193% -0.300% 2.49% D
NM                    405,995                 497,346                 903,341               423,405              478,813                923,458 4.112% -3.871% 2.18% D
DE                    197,742                 283,273                 500,750               214,351              289,758                511,697 7.749% 2.238% 2.14% D
WY                    198,371                   63,706                 262,077               192,633                70,527                267,353 -2.979% 9.671% 1.97% R
TN                 1,916,591             1,027,428              3,005,522           1,964,499          1,055,069            3,062,922 2.439% 2.620% 1.87% R
MN                 1,291,725             1,792,474              3,186,151           1,519,032          1,656,979            3,240,913 14.964% -8.177% 1.69% D
UT                    914,667                 464,504              1,463,139               883,768              562,549            1,487,882 -3.496% 17.429% 1.66% R
NC                 2,241,308             3,069,506              5,591,558           2,898,428          2,715,380            5,679,658 22.672% -13.041% 1.55% R Governor – Mark Robinson race
MI                 2,693,680             2,712,686              5,577,183           2,816,636          2,736,533            5,662,504 4.365% 0.871% 1.51% R
NH*                    434,857                 360,144                 811,120               395,346              417,544                822,528 -9.994% 13.747% 1.39% D Governor
NV                    677,046                 701,105              1,464,728               751,205              705,197            1,484,840 9.872% 0.580% 1.35% R
NE                    498,228                 435,743                 933,971               563,866              369,819                946,041 11.641% -17.826% 1.28% R
FL                 5,977,706             4,603,077           10,757,415           6,110,125          4,683,038          10,893,547 2.167% 1.707% 1.25% R
AZ                 1,595,761             1,676,335              3,347,964           1,770,242          1,582,860            3,389,319 9.856% -5.905% 1.22% R
MO                 1,646,686             1,236,505              2,959,514           1,750,625          1,199,751            2,991,373 5.937% -3.063% 1.07% R
MS                    761,833                 450,718              1,212,551               746,305              465,357            1,225,239 -2.081% 3.146% 1.04% R
VA                 2,019,822             2,416,698              4,436,520           2,075,009          2,335,076            4,482,177 2.660% -3.495% 1.02% D
PA                 3,399,571             3,384,431              6,963,694           3,543,609          3,423,287            7,034,768 4.065% 1.135% 1.01% R
MA                 1,365,445             2,041,693              3,419,392           1,251,308          2,126,545            3,453,459 -9.121% 3.990% 0.99% D
VT                    116,512                 229,542                 363,234               119,392              235,792                366,399 2.412% 2.651% 0.86% D
WI                 1,643,692             1,672,647              3,387,420           1,697,784          1,668,077            3,415,154 3.186% -0.274% 0.81% R
TX                 5,990,744             5,031,479           11,289,280           6,393,598          4,835,297          11,380,171 6.301% -4.057% 0.80% R
WV                    514,079                 207,548                 756,925               533,556              214,309                762,390 3.650% 3.155% 0.72% R
ND                    241,569                 121,602                 363,171               246,505              112,327                365,059 2.002% -8.257% 0.52% R
MD                 1,292,858             1,645,428              3,007,545           1,034,331          1,896,833            3,008,460 -24.995% 13.254% 0.03% D
MT                    319,640                 276,255                 607,174               352,014              231,858                602,949 9.197% -19.148% -0.70% R

Doesn’t look like it — NJ is the highest, but the reporting is not as complete for the Senate race. RI just shows >95% reporting for both, so it could be a similar “wait a few weeks for the real numbers” situation.

These stats were updated 03 Dec, 2024.

Kafka Metadata Mismatch

I’ll prefix this with a caveat — when Zookeeper and the Kafka metadata properties topic ID values don’t match up … there’s something wrong beyond “hey, make this string the same as that string and try again”. Look for communication issues, disk issues, etc that might lead to bad data. And, lacking any cause, the general recommendation is to drop and recreate the topic.

But! “Hey, I am going to delete all the data in this Kafka topic. Everyone good with that?” is seldom answered with a resounding “of course, we don’t actually want to keep the data we specifically configured a system to keep”. And you need to keep the topic around even though something has clearly gone sideways. Fortunately, you can manually update either the zookeeper topic ID or the one on disk. I find it easier to update the one on disk in Kafka because this change can be reverted. Stop all of the Kafka servers. The following script runs on each Kafka server – identifies all of the folders within the Kafka data for the partition and changes the wrong topic ID to the right one. Then start the Kafka servers again, and the partition should be functional. For now.

#!/bin/bash

# Function to check if Kafka is stopped
check_kafka_stopped() {
    if systemctl is-active --quiet kafka; then
        echo "Error: Kafka service is still running. Please stop Kafka before proceeding."
        exit 1
    else
        echo "Kafka service is stopped. Proceeding with backup and update."
    fi
}

# Define the base directory where Kafka stores its data
DATA_DIR="/path/todata-kafka"

# Define the topic prefix to search for
TOPIC_PREFIX="MY_TOPIC_NAME-"

# Old and new topic IDs
OLD_TOPIC_ID="2xSmlPMBRv2_ihuWgrvQNA"
NEW_TOPIC_ID="57kBnenRTo21_VhEhWFOWg"

# Date string for backup file naming
DATE_STR=$(date +%Y%m%d)

# Check if Kafka is stopped
check_kafka_stopped

# Find all directories matching the topic pattern and process each one
for dir in $DATA_DIR/${TOPIC_PREFIX}*; do
    # Construct the path to the partition.metadata file
    metadata_file="$dir/partition.metadata"

    # Check if the metadata file exists
    if [[ -f "$metadata_file" ]]; then
        # Backup the existing partition.metadata file
        backup_file="$dir/partmetadata.$DATE_STR"
        echo "Backing up $metadata_file to $backup_file"
        cp "$metadata_file" "$backup_file"

        # Use sed to replace the line containing the old topic_id with the new one
        echo "Updating topic_id in $metadata_file"
        sed -i "s/^topic_id: $OLD_TOPIC_ID/topic_id: $NEW_TOPIC_ID/" "$metadata_file"
    else
        echo "No partition.metadata file found in $dir"
    fi
done

echo "Backup and topic ID update complete."

How do you get the Kafka metadata and Zookeeper topic IDs? In Zookeeper, ask it:

kafkaserver::fixTopicID # bin/zookeeper-shell.sh $(hostname):2181
get /brokers/topics/MY_TOPIC_NAME
{"removing_replicas":{},"partitions":{"2":[251,250],"5":[249,250],"27":[248,247],"12":[248,251],"8":[247,248],"15":[251,250],"21":[247,250],"18":[249,248],"24":[250,248],"7":[251,247],"1":[250,249],"17":[248,247],"23":[249,247],"26":[247,251],"4":[248,247],"11":[247,250],"14":[250,248],"20":[251,249],"29":[250,249],"6":[250,251],"28":[249,248],"9":[248,249],"0":[249,248],"22":[248,251],"16":[247,251],"19":[250,249],"3":[247,251],"10":[251,249],"25":[251,250],"13":[249,247]},"topic_id":"57kBnenRTo21_VhEhWFOWg","adding_replicas":{},"version":3}

Kafka’s is stored on disk in each folder for a topic partition:

kafkaserver::fixTopicID # cat /path/to/data-kafka/MY_TOPIC_NAME-29/partition.metadata
version: 0
topic_id: 2xSmlPMBRv2_ihuWgrvQNA

Once the data is processed, it would be a good idea to recreate the topic … but ensuring the two topic ID values match up will get you back online.
Python: Getting Active Directory Subnets

Like my script that pulls the AD site information – this lets me see what subnets are defined and which sites are assigned to those subnets. I was able to quickly confirm that the devices that had problems communicating with Active Directory don’t have a site defined. Way back in 2000, we created a “catch all” 10.0.0.0/8 subnet and assigned it to the user authentication site. New networks on a whole different addressing scheme don’t have a site assignment. It should still work, but the application in question has historically had issues with going the “Ok, list ’em all” route.

from ldap3 import Server, Connection, ALL, SUBTREE, Tls
import ssl
import getpass

# Attempt to import USERNAME and PASSWORD from config.py
try:
    from config import USERNAME, PASSWORD
except ImportError:
    USERNAME, PASSWORD = None, None

# Define constants
LDAP_SERVER = 'ad.example.com'
LDAP_PORT = 636

def get_subnets_and_sites(username, password):
    # Set up TLS configuration
    tls_configuration = Tls(validate=ssl.CERT_REQUIRED, version=ssl.PROTOCOL_TLSv1_2)

    # Connect to the LDAP server
    server = Server(LDAP_SERVER, port=LDAP_PORT, use_ssl=True, tls=tls_configuration, get_info=ALL)
    connection = Connection(server, user=username, password=password, authentication='SIMPLE', auto_bind=True)

    # Define the search base for subnets
    search_base = 'CN=Subnets,CN=Sites,CN=Configuration,DC=example,DC=com'  # Change this to match your domain's DN
    search_filter = '(objectClass=subnet)'  # Filter to find all subnet objects
    search_attributes = ['cn', 'siteObject']  # Retrieve the common name and site object references

    # Perform the search
    connection.search(search_base, search_filter, SUBTREE, attributes=search_attributes)

    # Extract and return subnets and their site assignments
    subnets_sites = []
    for entry in connection.entries:
        subnet_name = entry.cn.value
        site_dn = entry.siteObject.value if entry.siteObject else "No site assigned"
        subnets_sites.append((subnet_name, site_dn))

    return subnets_sites

def print_subnets_and_sites(subnets_sites):
    if subnets_sites:
        print("\nSubnets and their Site Assignments:")
        for subnet, site in subnets_sites:
            print(f"Subnet: {subnet}, Site: {site}")
    else:
        print("No subnets found in the domain.")

def main():
    # Prompt for username and password if not available in config.py
    username = USERNAME if USERNAME else input("Enter your LDAP username: ")
    password = PASSWORD if PASSWORD else getpass.getpass("Enter your LDAP password: ")

    subnets_sites = get_subnets_and_sites(username, password)
    print_subnets_and_sites(subnets_sites)

if __name__ == "__main__":
    main()

Python: Get Active Directory Sites

One down side of not administering the Active Directory domain anymore is that I don’t have the quick GUI tools that show you how “stuff” is set up. Luckily, the sites are all reflected in AD objects that can be read by authenticated users:

from ldap3 import Server, Connection, ALL, SIMPLE, SUBTREE, Tls
import ssl
import getpass

# Attempt to import USERNAME and PASSWORD from config.py
try:
    from config import USERNAME, PASSWORD
except ImportError:
    USERNAME, PASSWORD = None, None

# Define constants
LDAP_SERVER = 'ad.example.com'
LDAP_PORT = 636

def get_all_sites(username, password):
    # Set up TLS configuration
    tls_configuration = Tls(validate=ssl.CERT_REQUIRED, version=ssl.PROTOCOL_TLSv1_2)

    # Connect to the LDAP server
    server = Server(LDAP_SERVER, port=LDAP_PORT, use_ssl=True, tls=tls_configuration, get_info=ALL)
    connection = Connection(server, user=username, password=password, authentication='SIMPLE', auto_bind=True)

    # Define the search base for sites
    search_base = 'CN=Sites,CN=Configuration,DC=example,DC=com'  # Update to match your domain's DN structure
    search_filter = '(objectClass=site)'  # Filter to find all site objects
    search_attributes = ['cn']  # We only need the common name (cn) of the sites

    # Perform the search
    connection.search(search_base, search_filter, SUBTREE, attributes=search_attributes)

    # Extract and return site names
    site_names = [entry['cn'].value for entry in connection.entries]
    return site_names

def print_site_names(site_names):
    if site_names:
        print("\nAD Sites:")
        for site in site_names:
            print(f"- {site}")
    else:
        print("No sites found in the domain.")

def main():
    # Prompt for username and password if not available in config.py
    username = USERNAME if USERNAME else input("Enter your LDAP username: ")
    password = PASSWORD if PASSWORD else getpass.getpass("Enter your LDAP password: ")

    site_names = get_all_sites(username, password)
    print_site_names(site_names)

if __name__ == "__main__":
    main()

Ohio Voter Turnout

The current data from https://liveresults.ohiosos.gov/ shows the five biggest counties in Ohio are all in the top ten “bad” voter turnout counties. Ohio’s unofficial turnout is 69.69%. At least so far.

County Registered Voters Ballots Counted Unofficial Voter Turnout Outstanding Absentees Outstanding Provisionals Total Precincts Election Day Precincts Reporting Election Day % Precincts Reporting Metro NonVoter Count
Greene 122,193 49,991 40.91 1,267 2,044 146 146 100 72,204
Lucas 304,907 187,235 61.41 2,856 4,426 303 303 100 Toledo 117,664
Lawrence 43,020 26,586 61.8 239 423 84 84 100 16,434
Cuyahoga 893,801 571,397 63.93 15,697 14,183 967 967 100 Cleveland 322,394
Athens 38,592 24,956 64.67 265 1,537 56 56 100 13,635
Franklin 903,493 592,418 65.57 9,235 19,563 888 888 100 Columbus 311,073
Pike 18,010 12,072 67.03 113 314 22 22 100 5,938
Hamilton 604,178 405,825 67.17 6,360 12,659 562 562 100 Cincinnati 198,352
Montgomery 373,582 251,763 67.39 4,909 6,200 381 381 100 Dayton 121,825
Scioto 45,434 30,666 67.5 247 1,041 77 77 100 14,766