Tag: ELK

OpenSearch Evaluation Overview

What is ElasticSearch?

ElasticSearch, based on the Lucene search software, is a distributed search and analytics application which ingests, stores, and indexes data. Kibana is a web-based front-end providing user access to data stored within ElasticSearch.

What is OpenSearch?

In short, it’s the same but different. OpenSearch is also based on the Lucene search software, is designed to be a distributed search and analytics application, and ingests/stores/indexes data. If it’s essentially the same thing, why does OpenSearch exist? ElasticSearch was initially licensed under the open-source Apache 2.0 license – a rather permissive free software license. ElasticCo did not agree with how their software was being used by Amazon; and, in 2021, the license for ElasticSearch was changed to Server Side Public License (SSPL). One of the requirements of SSPL is that anyone who implements the software and sells their implementation as a service needs to publish their source code under the SSPL license – not just changes made to the original program but all other software a user would require to run the software-as-a-service environment for themselves. Amazon used ElasticSearch for their Amazon Elasticsearch Service offering, but was unable/unwilling to continue doing so under the new license terms. In April of 2021, Amazon Web Services created a fork of ElasticSearch as the basis for OpenSearch.

Differences Between OpenSearch and ElasticSearch

After the OpenSearch fork was created, the product roadmap for ElasticSearch was driven by ElasticCo and the roadmap for OpenSearch was community driven (with significant oversight and input from Amazon) – this means the products are not identical although they provide the same core functionality. Elastic publishes a list of features unique to ElasticSearch, and the underlying machine learning algorithms are different. However, the important components of the “unique” feature list have been implemented in OpenSearch over time.

The biggest differences are price and support. OpenSearch is free software – there is no purchasing a license to unlock features. It does appear that Amazon has an internal iteration of OpenSearch as their as-a-service offering provides features not available in the open-source OpenSearch code base, but that is only available for cloud customers. ElasticCo offers ElasticSearch as free software with a limited feature set. One critical limitation is user authentication mechanisms – we are unable to implement PingID as an authentication source with the free feature set. Advanced features not currently used today – machine learning based anomaly detection, as an example – are also unavailable in the free iteration of ElasticSearch. With an ElasticSearch license, we would also get vendor support. OpenSearch does not offer vendor support, although there are third party companies that will provide support services.

Both OpenSearch and ElasticSearch have community-based support forums available – I have gotten responses from developers on both forums for questions regarding usage nuances.

Salient Feature Comparison

Most companies have a list differentiating their product from the products offered by competitors – but the important thing is how the products differ as it relates to how an individual customer uses the product. A car that can have a fresh cup of espresso waiting for you as you leave for work might be amazing to some people, but those who don’t drink coffee won’t be nearly as impressed. So how do the two products compare for me?

Data ingestion – Data is ingested using the same mechanisms – ElasticCo’s filebeat and logstash are important components of data ingestion, and these components remain unchanged. This means existing processes that feed data into ElasticSearch today would not need to be changed to begin ingesting data into OpenSearch.

Data storage – Both products distribute searchable data over a cluster of servers. Data storage is “tiered” as hot, warm, and cold which allows less used data to reside on slower, less expensive resources. We have confirmed that ingested data is properly housed on cluster nodes designated for ‘hot’ storage and moved to ‘warm’ and ‘cold’ storage as dictated by defined policies. The item count to size ratio is similar between both products (i.e. storing ten million documents takes about the same amount of disk space). OpenSearch provides the ability to alert on transition failures (moving from hot to warm, for instance) which will reduce the amount of manual “health checking” required for the environment.

Search and aggregation – Both products allow both GUI and API searches of indexed data. Data can be aggregated as it is searched – returning the max/min/average value from a search, a count of records matching search criterion, creating sub-aggregations. ElasticSearch does have aggregations not available in OpenSearch, although these could be handled through custom scripted aggregations and many have corresponding GitHub issues requesting such an aggregation be added to OpenSearch (e.g. weighted average, geohash grid, or geotile grid)

Aggregation Name ElasticSearch 8.x OpenSearch 2.x
auto-interval date histogram x
categorize text x
children x
composite x
frequent items x
geohex grid x
geotile grid x
ip prefix x
multi terms x
parent x
random sampler x
rare terms x
terms x
variable width histogram x
boxplot x
geo-centroid x
geo-line x
median absolute deviation x
rate x
string stats x
t-test x
top metrics x
weighted avg x

Alerting – ElastAlert2 can be used to provide the same index monitoring and alerting functionality that ElastAlert currently provides with ElasticSearch. Additionally, OpenSearch includes a built-in alerting capability that might allow us to streamline the functionality into the base OpenSearch implementation.

API Access – Both ElasticSearch and OpenSearch provide API-based access to data. Queries to the ElasticSearch API endpoint returned expected data when directed to the OpenSearch API endpoint. The ElasticSearch python module can be used to access OpenSearch data, although there is a specific OpenSearch module as well.

UX – ElasticSearch allows users to search and visualize data through Kibana; OpenSearch provides graphical user access in OpenSearch Dashboard. While the “look and feel” of the GUI differs (Kibana 8 looks different than the Kibana 7 we use today, too), the user functionality remains the same.

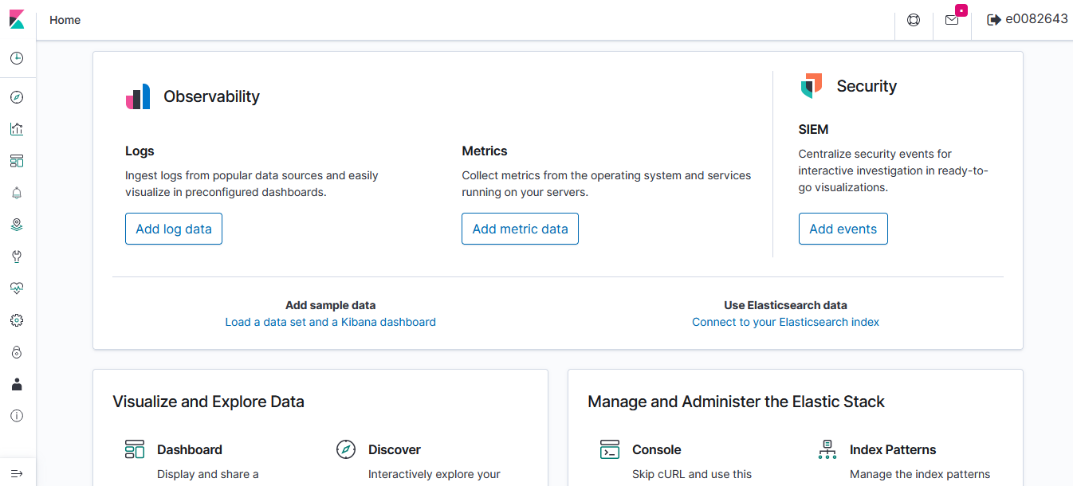
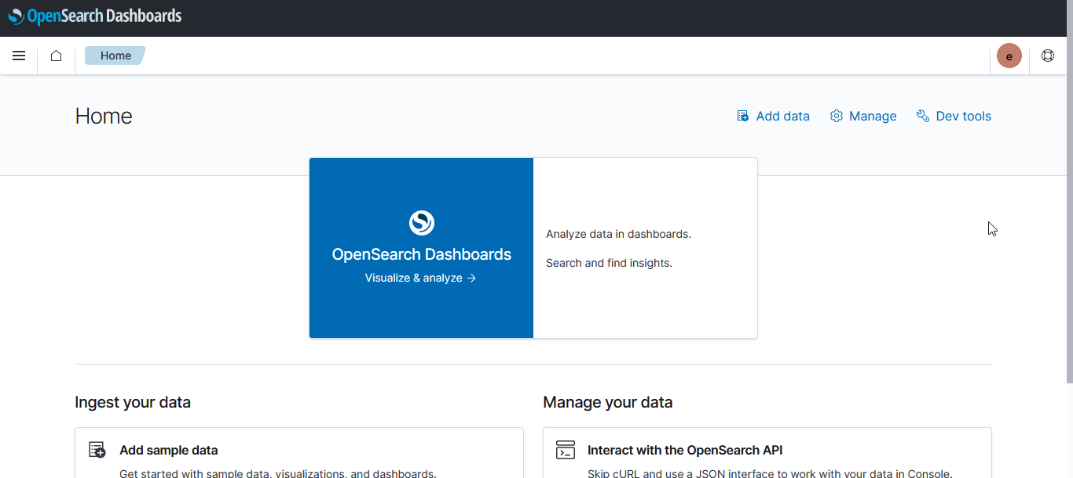
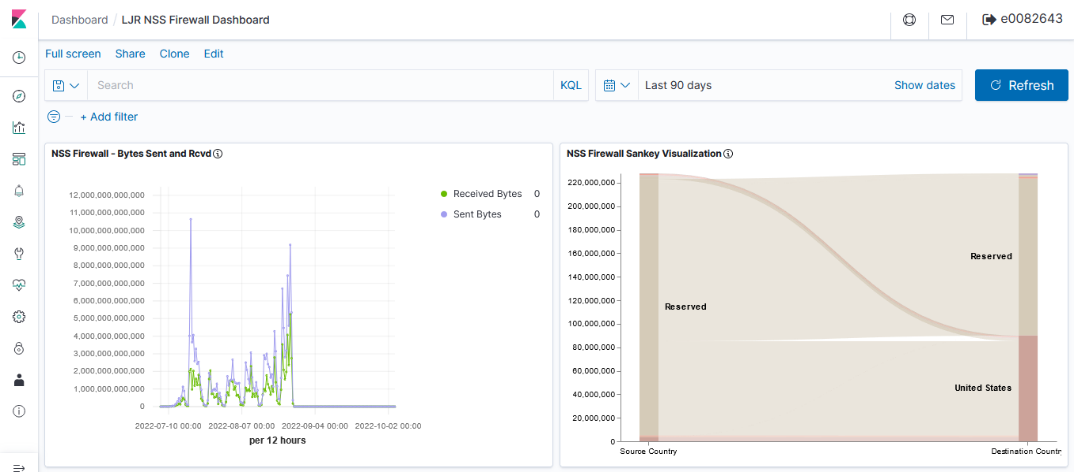
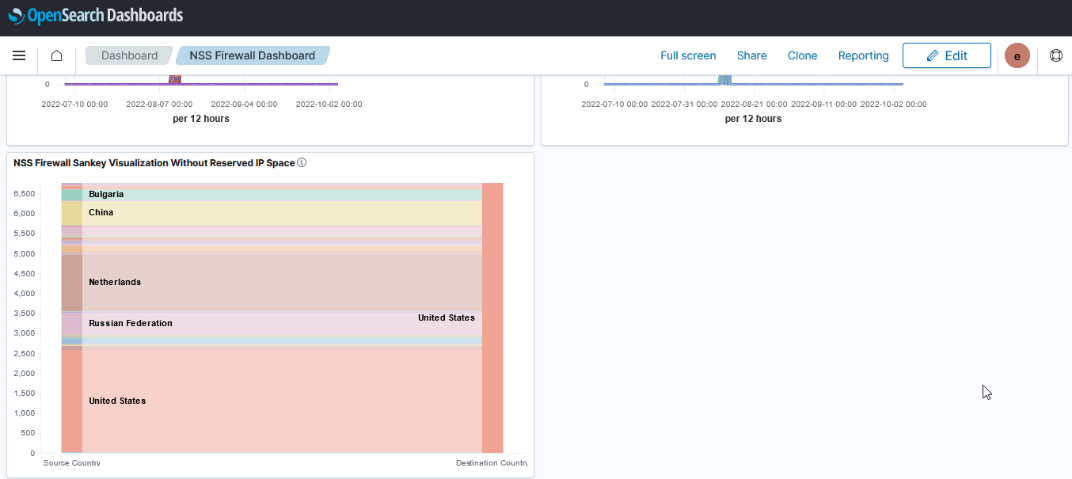
Kibana 7.7 OpenSearch Dashboards 2.2

Kibana uses “KQL” – Kibana Query Language – to compose searches while OpenSearch Dashboards uses “DQL” – Dashboards Query Language, but queries used in Kibana were used in OpenSearch Dashboard without modification.

Currently used visualizations are available in both Kibana and OpenSearch Dashboards

Kibana Visualization OpenSearch Dashboards Visualization

But there are some currently unused visualizations that are unique to each product.

Visualization Kibana OpenSearch Dashboard
Area x x
Controls x x
Coordinate Map x
Data Table x x
Gantt Chart x
Gauge x x
Goal x x
Heat Map x x
Horizonal Bar x x
Lens x
Line x x
Maps x
Markdown x x
Metric x x
Pie x x
Region Map x
Tag Cloud x x
Timeline x x
TSVB x x
Vega x x
Vertical Bar x x

Dashboards can be used to group visualizations.

Kibana OpenSearch Dashboards

New features will be available in either OpenSearch or a licensed installation of ElasticSearch. Currently data is either retained as written or aged out of the system to save disk space. Either path allows us to roll up data – as an example retaining the total number of users per month or total bytes per month instead of retaining each detailed record. Additionally, we will be able to use the “anomaly detection” which is able to monitor large volumes of index data and highlight unusual events. Both newer ElasticSearch versions and OpenSearch offer a Tableau connector which may make data stored in the platform more accessible to users.
 

Logstash – Filtering data with Ruby

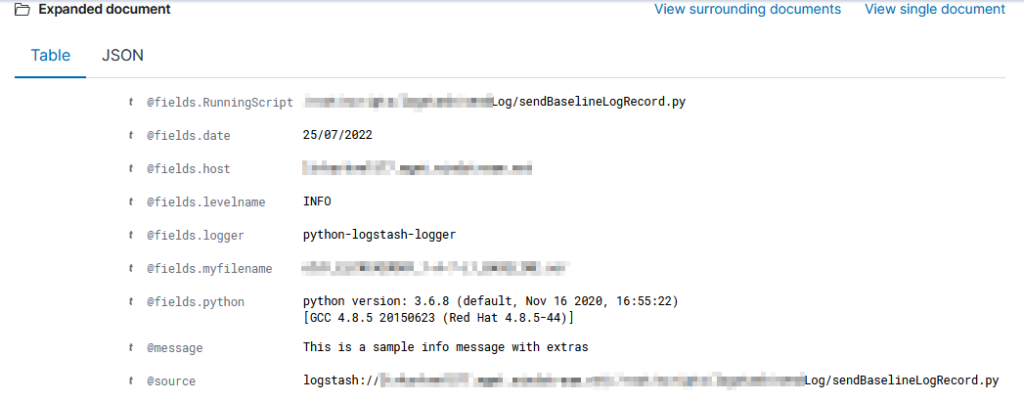
I’ve been working on forking log data into two different indices based on an element contained within the record — if the filename being sent includes the string “BASELINE”, then the data goes into the baseline index, otherwise it goes into the scan index. The data being ingested has the file name in “@fields.myfilename”

It took a while to figure out how to get the value from the current data — event.get(‘[@fields][myfilename]’) to get the @fields.myfilename value.

The following logstash config accepts JSON inputs, parses the underscore-delimited filename into fields, replaces the dashes with underscores as KDL doesn’t handle dashes and wildcards in searches, and adds a flag to any record that should be a baseline. In the output section, that flag is then used to publish data to the appropriate index based on the baseline flag value.

input {
  tcp {
    port => 5055
    codec => json
  }
}
filter {
        # Sample file name: scan_ABCDMIIWO0Y_1-A-5-L2_BASELINE.json
        ruby {  code => "
                        strfilename = event.get('[@fields][myfilename]')
                        arrayfilebreakout = strfilename.split('_')
                        event.set('hostname', arrayfilebreakout[1])
                        event.set('direction',arrayfilebreakout[2])
                        event.set('parseablehost', strfilename.gsub('-','_'))

                        if strfilename.downcase =~ /baseline/
                                event.set('baseline', 1)
                        end" }
}
output {
        if [baseline] == 1 {
                elasticsearch {
                        action => "index"
                        hosts => ["https://elastic.example.com:9200"]
                        ssl => true
                        cacert => ["/path/to/logstash/config/certs/My_Chain.pem"]
                        ssl_certificate_verification => true
                        # Credentials go here
                        index => "ljr-baselines"
                }
        }
        else{
              elasticsearch {
                        action => "index"
                        hosts => ["https://elastic.example.com:9200"]
                        ssl => true
                        cacert => ["/path/to/logstash/config/certs/My_Chain.pem"]
                        ssl_certificate_verification => true
                        # Credentials go here
                        index => "ljr-scans-%{+YYYY.MM.dd}"
                }
        }
}

Kibana Visualization – Vega Line Chart with Baseline

There’s often a difference between hypothetical (e.g. the physics formula answer) and real results — sometimes this is because sciences will ignore “negligible” factors that can be, well, more than negligible, sometimes this is because the “real world” isn’t perfect. In transmission media, this difference is a measurable “loss” — hypothetically, we know we could send X data in Y delta-time, but we only sent X’. Loss also happens because stuff breaks — metal corrodes, critters nest in fiber junction boxes, dirt builds up on a dish. And it’s not easy, when looking at loss data at a single point in time, to identify what’s normal loss and what’s a problem.

We’re starting a project to record a baseline of loss for all sorts of things — this will allow individuals to check the current loss data against that which engineers say “this is as good as it’s gonna get”. If the current value is close … there’s not a problem. If there’s a big difference … someone needs to go fix something.

Unfortunately, creating a graph in Kibana that shows the baseline was … not trivial. There is a rule mark that allows you to draw a straight line between two points. You cannot just say “draw a line at ​y​ from 0 to some large value that’s going to be off the graph. The line doesn’t render (say, 0 => today or the year 2525). You cannot just get the max value of the axis.

I finally stumbled across a series of data contortions that make the baseline graphable.

The data sets I have available have a datetime object (when we measured this loss) and a loss value. For scans, there may be lots of scans for a single device. For baselines, there will only be one record.

The joinaggregate transformation method — which appends the value to each element of the data set — was essential because I needed to know the largest datetime value that would appear in the chart.

           , {“type”: “joinaggregate”, “fields”: [“transformedtimestamp”], “ops”: [“max”], “as”: [“maxtime”]}

The lookup transformation method — which can access elements from other data sets — allowed me to get that maximum timestamp value into the baseline data set. Except … lookup needs an exact match in the search field. Luckily, it does return a random (I presume either first or last … but it didn’t matter in this case because all records have the same max date value) record when multiple matches are found.

So I used a formula transformation method to add a constant to each record as well

           , {“type”: “formula”, “as”: “pi”, “expr”: “PI”}

Now that there’s a record to be found, I can add the max time from our scan data into our baseline data

                , {“type”: “lookup”, “from”: “scandata”, “key”: “pi”, “fields”: [“pi”], “values”: [“maxtime”], “as”: [“maxtime”]}

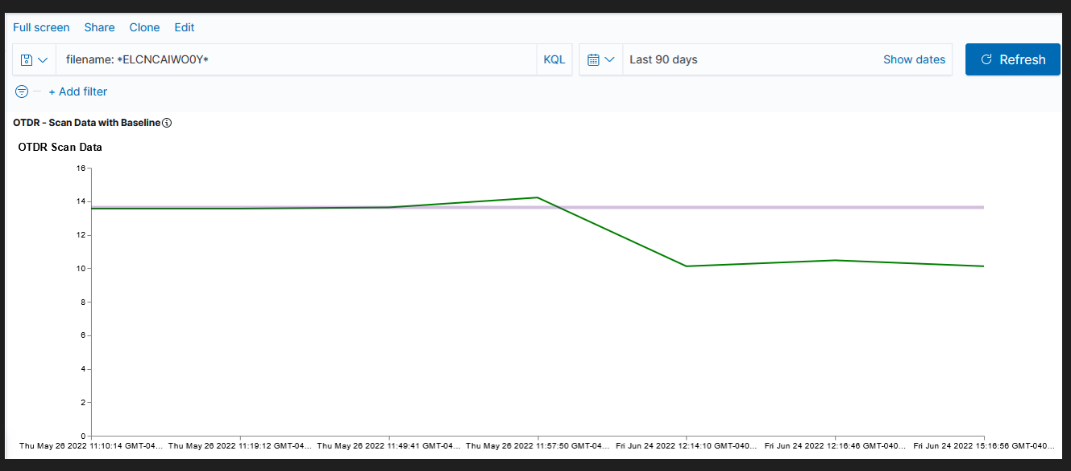
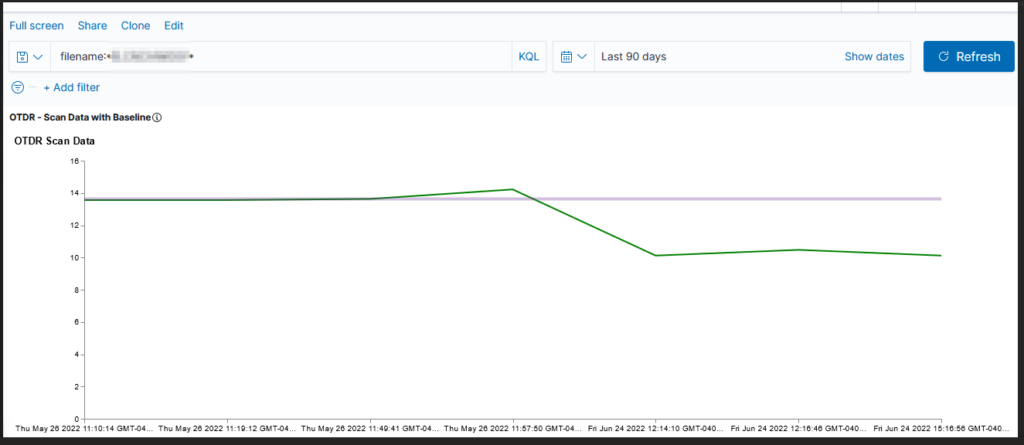
Voila — a chart with a horizontal line at the baseline loss value. Yes, I randomly copied a record to use as the baseline and selected the wrong one (why some scans are below the “good as it’s ever going to get” baseline value!). But … once we have live data coming into the system, we’ll have reasonable looking graphs.

The full Vega spec for this graph:

{
    "$schema": "https://vega.github.io/schema/vega/v4.json",
      "description": "Scan data with baseline",
    "padding": 5,

    "title": {
        "text": "Scan Data",
        "frame": "bounds",
        "anchor": "start",
        "offset": 12,
        "zindex": 0
      },
    "data": [
    {
        "name": "scandata",
        "url": {
            "%context%": true,
            "%timefield%": "@timestamp",
            "index": "traces-*",
            "body": {
            "sort": [{
                "@timestamp": {
                    "order": "asc"
                }
            }],
            "size": 10000,
            "_source":["@timestamp","Events.Summary.total loss"]
            }
        }
        ,"format": { "property": "hits.hits"}
        ,"transform":[
            {"type": "formula", "expr": "datetime(datum._source['@timestamp'])", "as": "transformedtimestamp"}
            , {"type": "joinaggregate", "fields": ["transformedtimestamp"], "ops": ["max"], "as": ["maxtime"]}
            , {"type": "formula", "as": "pi", "expr": "PI"}
        ]
    }
  ,
   {
        "name": "baseline",
        "url": {
            "%context%": true,
            "index": "baselines*",
            "body": {
                "sort": [{
                    "@timestamp": {
                        "order": "desc"
                    }
                }],
                "size": 1,
                "_source":["@timestamp","Events.Summary.total loss"]
            }
        }
        ,"format": { "property": "hits.hits" }
        ,"transform":[
                {"type": "formula", "as": "pi", "expr": "PI"}
                , {"type": "lookup", "from": "scandata", "key": "pi", "fields": ["pi"], "values": ["maxtime"], "as": ["maxtime"]}
        ]
  }
]      
,
    "scales": [
      {
        "name": "x",
        "type": "point",
        "range": "width",
        "domain": {"data": "scandata", "field": "transformedtimestamp"}
      },
      {
        "name": "y",
        "type": "linear",
        "range": "height",
        "nice": true,
        "zero": true,
        "domain": {"data": "scandata", "field": "_source.Events.Summary.total loss"}
      }
    ],
        "axes": [
      {"orient": "bottom", "scale": "x"},
      {"orient": "left", "scale": "y"}
    ],
     "marks": [
                {
            "type": "line",
            "from": {"data": "scandata"},
            "encode": {
              "enter": {
                "x": { "scale": "x", "field": "transformedtimestamp", "type": "temporal",
      "timeUnit": "yearmonthdatehourminute"},
                "y": {"scale": "y",       "type": "quantitative","field": "_source.Events.Summary.total loss"},
                "strokeWidth": {"value": 2},
                "stroke": {"value": "green"}
              }
            }
          }
                 ,        {
            "type": "rule",
            "from": {"data": "baseline"},
            "encode": {
              "enter": {
                "stroke": {"value": "#652c90"},
                "x": {"scale": "x", "value": 0},
                "y": {"scale": "y",      "type": "quantitative","field": "_source.Events.Summary.total loss"},
                "x2": {"scale": "x","field": "maxtime", "type": "temporal"},
                "strokeWidth": {"value": 4},
                "opacity": {"value": 0.3}
              }
            }
          }
     ]         
}

Vega Visualization when Data Element Name Contains At Symbol

We have data created by an external source (i.e. I cannot just change the names used so it works) — the datetime field is named @timestamp and I had an awful time figuring out out how to address that element within a transformation expression.

Just to make sure I wasn’t doing something silly, I created a copy of the data element named without the at symbol. Voila – transformedtimestamp is populated with a datetime element.

This works fine if the data element is named 'timestamp'

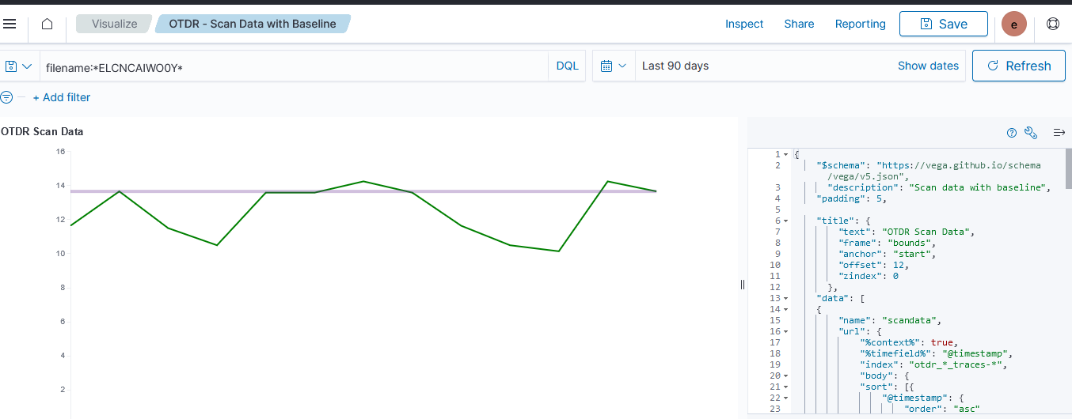
I finally figured it out – it appears that I have encountered a JavaScript limitation. Instead of using the dot-notation to access the element, the array subscript method works – not datum.@timestamp in any iteration or with any combination of escapes.

enter image description here


Logstash

General Info

Logstash is a pipeline based data processing service. Data comes into logstash, is manipulated, and is sent elsewhere. The source is maintained on GitHub by ElasticCo.

Installation

Logstash was downloaded from ElasticCo and installed from a gzipped tar archive to the /opt/elk/logstash folder.

Configuration

The Logstash server is configured using the logstash.yml file.

Logstash uses Log4J 2 for logging. Logging configuration is maintained in the log4j2.properties file

Logstash is java-based, and the JVM settings are maintained in the jvm.options file – this includes min heap space, garbage collection configuration, JRuby settings, etc.

Logstash loads the pipelines defined in /opt/elk/logstash/config/pipelines.yml – each pipeline needs an ID and a path to its configuration. The path can be to a config file or to a folder of config files for the pipeline. The number of workers for the pipeline defaults to the number of CPUs, so we normally define a worker count as well – this can be increased as load dictates.

– pipeline.id: LJR
pipeline.workers: 2
path.config: “/opt/elk/logstash/config/ljr.conf”

Each pipeline is configured in an individual config file that defines the input, any data manipulation to be performed, and the output.

Testing Configuration

As we have it configured, you must reload Logstash to implement any configuration changes. As errors in pipeline definitions will prevent the pipeline from loading, it is best to test the configuration prior to restarting Logstash.

/opt/elk/logstash/bin/logstash –config.test_and_exit -f ljr_firewall_logs_wip.conf

Some errors may occur – if the test ends with “Configuration OK”, then it’s OK!

Automatic Config Reload

The configuration can automatically be reloaded when changes to config files are detected. This doesn’t give you the opportunity to test a configuration prior to it going live on the server (once it’s saved, it will be loaded … or not loaded if there’s an error)

Input

Input instructs logstash about what format data the pipeline will receive – is JSON data being sent to the pipeline, is syslog sending log data to the pipeline, or does data come from STDIN? The types of data that can be received are defined by the input plugins. Each input has its own configuration parameters. We use Beats, syslog, JSON (a codec, not a filter type), Kafka, stuff

The input configuration also indicates which port to use for the pipeline – this needs to be unique!

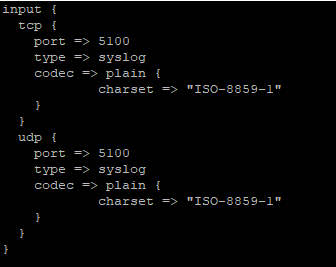
Input for a pipeline on port 5055 receiving JSON formatted data

Input for a pipeline on port 5100 (both TCP and UDP) receiving syslog data

Output

Output is similarly simple – various output plugins define the systems to which data can be shipped. Each output has its own configuration parameters – ElasticSearch, Kafka, and file are the three output plug-ins we currently use.

ElasticSearch

Most of the data we ingest into logstash is processed and sent to ElasticSearch. The data is indexed and available to users through ES and Kibana.

Kafka

Some data is sent to Kafka basically as a holding queue. It is then picked up by the “aggregation” logstash server, processed some more, and relayed to the ElasticSearch system.

File

File output is generally used for debugging – seeing the output data allows you to verify your data manipulations are working property (as well as just make sure you see data transiting the pipeline without resorting to tcpdump!).

Filter

Filtering allows data to be removed, attributes to be added to records, and parses data into fields. The types of filters that can be applied are defined by the filter plugins. Each plugin has its own documentation. Most of our data streams are filtered using Grok – see below for more details on that.

Conditional rules can be used in filters. This example filters out messages that contain the string “FIREWALL”, “id=firewall”, or “FIREWALL_VRF” as the business need does not require these messages, so there’s no reason to waste disk space and I/O processing, indexing, and storing these messages.

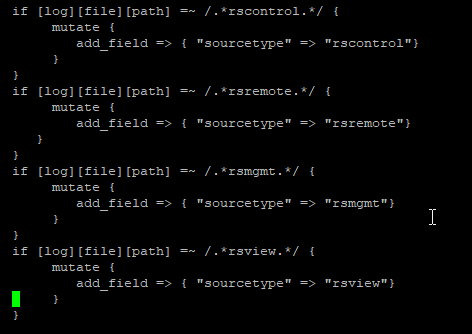
This example adds a field, ‘sourcetype’, with a value that is based on the log file path.

Grok

The grok filter is a Logstash plugin that is used to extract data from log records – this allows us to pull important information into distinct fields within the ElasticSearch record. Instead of having the full message in the ‘message’ field, you can have success/failure in its own field, the logon user in its own field, or the source IP in its own field. This allows more robust reporting. If the use case just wants to store data, parsing the record may not be required. But, if they want to report on the number of users logged in per hour or how much data is sent to each IP address, we need to have the relevant fields available in the document.

Patterns used by the grok filter are maintained in a Git repository – the grok-patterns contains the data types like ‘DATA’ in %{DATA:fieldname}

The following are the ones I’ve used most frequently:

Name Field Type Pattern Notes Notes
DATA Text data .*? This does not expand to the most matching characters – so looking for foo.*?bar in “foobar is not really a word, but foobar gets used a lot in IT documentation” will only match the bold portion of the text
GREEDYDATA Text data .* Whereas this matches the most matching characters – so foo.*bar in “foobar is not really a word, but foobar gets used a lot in IT documentation” matches the whole bold portion of the text
IPV4 IPv4 address
IPV6 IPv6 address
IP IP address – either v4 or v6 (?:%{IPV6}|%{IPV4}) This provides some flexibility as groups move to IPv6 – but it’s a more complex filter, so I’ve been using IPV4 with the understanding that we may need to adjust some parsing rules in the future
LOGLEVEL Text data Regex to match list of standard log level strings – provides data validation over using DATA (i.e. if someone sets their log level to “superawful”, it won’t match)
SYSLOGBASE Text data This matches the standard start of a syslog record. Often used as “%{SYSLOGBASE} %{GREEDYDATA:msgtext}” to parse out the timestamp, facility, host, and program – the remainder of the text is mapped to “msgtext”
URI Text data protocol://stuff text is parsed into the protocol, user, host, path, and query parameters
INT Numeric data (?:[+-]?(?:[0-9]+)) Signed or unsigned integer
NUMBER Numeric data Can include a casting like %{NUMBER:fieldname;int} or %{NUMBER:fieldname;float}
TIMESTAMP_ISO8601 DateTime %{YEAR}-%{MONTHNUM}-%{MONTHDAY}[T ]%{HOUR}:?%{MINUTE}(?::?%{SECOND})?%{ISO8601_TIMEZONE}? There are various other date patterns depending on how the string will be formatted. This is the one that matches YYYYMMDDThh:mm:ss

Parsing an entire log string

In a system with a set format for log data, parsing the entire line is reasonable – and, often, there will be a filter for well-known log types. I.E. if you are using the default Apache HTTPD log format, you don’t need to write a filter for each component of the log line – just match either the HTTPD_COMBINEDLOG or HTTPD_COMMONLOG pattern.

match => { “message” => “%{HTTPD_COMMONLOG}” }

But you can create your own filter as well – internally developed applications and less common vendor applications won’t have prebuilt filter rules.

match => { “message” => “%{TIMESTAMP_ISO8601:logtime} – %{IPV4:srcip} – %{IPV4:dstip} – %{DATA:result}” }

Extracting an array of data

Instead of trying to map an entire line at once, you can extract individual data elements by matching an array of patterns within the message.

match => { “message” => [“srcip=%{IPV4:src_ip}”
, “srcport=%{NUMBER:srcport:int}”
,”dstip=%{IPV4:dst_ip}”
,”dstport=%{NUMBER:dstport:int}”] }

This means the IP and port information will be extracted regardless of the order in which the fields are written in the log record. This also allows you to parse data out of log records where multiple different formats are used (as an example, the NSS Firewall logs) instead of trying to write different parsers for each of the possible string combinations.

Logstash, by default, breaks when a match is found. This means you can ‘stack’ different filters instead of using if tests. Sometimes, though, you don’t want to break when a match is found – maybe you are extracting a bit of data that gets used in another match. In these cases, you can set break_on_match to ‘false’ in the grok rule.

I have also had to set break_on_match when extracting an array of values from a message.

Troubleshooting

Log Files

Logstash logs output to /opt/elk/logstash/logs/logstash-plain.log – the logging level is defined in the /opt/elk/logstash/config/log4j2.properties configuration file.

Viewing Data Transmitted to a Pipeline

There are several ways to confirm that data is being received by a pipeline – tcpdump can be used to verify information is being received on the port. If no data is being received, the port may be offline (if there is an error in the pipeline config, the pipeline will not load – grep /opt/elk/logstash/logs/logstash-plain.log for the pipeline name to view errors), there may be a firewall preventing communication, or the sender could not be transmitting data.

tcpdump dst port 5100 -vv

If data is confirmed to be coming into the pipeline port, add a “file” output filter to the pipeline.

Issues

Data from filebeat servers not received in ElasticSearch

We have encountered a scenario were data from the filebeat servers was not being transmitted to ElasticSearch. Monitoring the filebeat server did not show any data being sent. Restarting the Logstash servers allowed data to be transmitted as expected.


ElasticSearch – Deleting Documents by Criterion

We have an index that was created without a lifecycle policy — and it’s taking up about 300GB of our 1.5T on the dev server. I don’t want to delete it — mostly because I don’t know why it’s there. But cleaning up old data seemed like a

POST /metricbeat_kafka-/_delete_by_query
{
  "query": {
    "range" : {
        "@timestamp" : {
            "lte" : "2021-02-04T01:47:44.880Z"
        }
    }
  }
}

ElasticSearch Search API – Script Fields

I’ve been playing around with script fields to manipulate data returned by ElasticSearch queries. As an example, data where there are a few nested objects with values that need to be multiplied together:

{
	"order": {
		"item1": {
			"cost": 31.55,
			"count": 111
		},
		"item2": {
			"cost": 62.55,
			"count": 222
		},
		"item3": {
			"cost": 93.55,
			"count": 333
		}
	}
}

And to retrieve records and multiply cost by count:

{
  "query"  : { "match_all" : {} },
	"_source": ["order.item*.item", "order.item*.count", "order.item*.cost"],
  "script_fields" : {
    "total_cost_1" : {
      "script" : 
      {
        "lang": "painless",
        "source": "return doc['order.item1.cost'].value * doc['order.item1.count'].value;"
      }
    },
    "total_cost_2" : {
      "script" : 
      {
        "lang": "painless",
        "source": "return doc['order.item2.cost'].value * doc['order.item2.count'].value;"
      }
    },
    "total_cost_3" : {
      "script" : 
      {
        "lang": "painless",
        "source": "return doc['order.item3.cost'].value * doc['order.item3.count'].value;"
      }
    }    
  }
}

Unfortunately, I cannot find any way to iterate across an arbitrary number of item# objects nested in the order object. So, for now, I think the data manipulation will be done in the program using the API to retrieve data. Still, it was good to learn how to address values in the doc record.

Upgrading Logstash

The process to upgrade minor releases of LogStash is quite simple — stop service, drop the binaries in place, and start service. In this case, my upgrade process is slightly complicated by the fact our binaries aren’t installed to the “normal” location from the RPM. I am upgrading from 7.7.0 => 7.17.4

The first step is, obviously, to download the LogStash release you want – in this case, it is 7.17.4 as upgrading across major releases is not supported.


cd /tmp
mkdir logstash
mv logstash-7.17.4-x86_64.rpm ./logstash

cd /tmp/logstash
rpm2cpio logstash-7.17.4-x86_64.rpm | cpio -idmv

systemctl stop logstash
mv /opt/elk/logstash /opt/elk/logstash-7.7.0
mv /tmp/logstash/usr/share/logstash /opt/elk/
mkdir /var/log/logstash
mkdir /var/lib/logstash

mv /tmp/logstash/etc/logstash /etc/logstash
cd /etc/logstash
mkdir rpmnew
mv jvm.options ./rpmnew/
mv log* ./rpmnew/
mv pipelines.yml ./rpmnew/
mv startup.options ./rpmnew/
cp -r /opt/elk/logstash-7.7.0/config/* ./

ln -s /opt/elk/logstash /usr/share/logstash
ln -s /etc/logstash /opt/elk/logstash/config

chown -R elasticsearch:elasticsearch /opt/elk/logstash
chown -R elasticsearch:elasticsearch /var/log/logstash
chown -R elasticsearch:elasticsearch /var/lib/logstash
chown -R elasticsearch:elasticsearch /etc/logstash

systemctl start logstash
systemctl status logstash
/opt/elk/logstash/bin/logstash --version

Using FileBeat to Send Data to ElasticSearch via Logstash

Before sending data, you need a pipleline on logstash to accept the data. If you are using an existing pipeline, you just need the proper host and port for the pipeline to use in the Filebeat configuration. If you need a new pipeline, the input needs to be of type ‘beats’

# Sample Pipeline Config:
input {
  beats   {
    host => "logstashserver.example.com"
    port => 5057
    client_inactivity_timeout => "3000"
  }
}

filter {
  grok{
     match => {"message"=>"\[%{TIMESTAMP_ISO8601:timestamp}] %{DATA:LOGLEVEL} \[Log partition\=%{DATA:LOGPARTITION}, dir\=%{DATA:KAFKADIR}\] %{DATA:MESSAGE} \(%{DATA:LOGSOURCE}\)"}
  }
}

output {
  elasticsearch {
    action => "index"
    hosts => ["https://eshost.example.com:9200"]
    ssl => true
    cacert => ["/path/to/certs/CA_Chain.pem"]
    ssl_certificate_verification => true
    user =>"us3r1d"
    password => "p@s5w0rd"
    index => "ljrkafka-%{+YYYY.MM.dd}"
  }
}


Download the appropriate version from https://www.elastic.co/downloads/past-releases#filebeat – I am currently using 7.17.4 as we have a few CentOS + servers.

Install the package (rpm -ihv filebeat-7.17.4-x86_64.rpm) – the installation package places the configuration files in /etc/filebeat and the binaries and other “stuff” in /usr/share/filebeat

Edit /etc/filebeat/filebeat.yml

    • Add inputs for log paths you want to monitor (this may be done under the module config if using a module config instead)
    • Add an output for Logstash to the appropriate port for your pipeline:
      output.logstash:
      hosts: [“logstashhost.example.com:5055”]

Run filebeat in debug mode from the command line and watch for success or failure.
filebeat -e -c /etc/filebeat/filebeat.yml -d "*"

Assuming everything is running well, use systemctl start filebeat to run the service and systemctl enable filebeat to set it to launch on boot.

Filebeats will attempt to parse the log data and send a JSON object to the LogStash server. When you view the record in Kibana, you should see any fields parsed out with your grok rule – in this case, we have KAFKADIR, LOGLEVEL, LOGPARTITION, LOGSOURCE, and MESSAGE fields.

Using Logstash to Send Data to ElasticSearch

Create a logstash pipeline

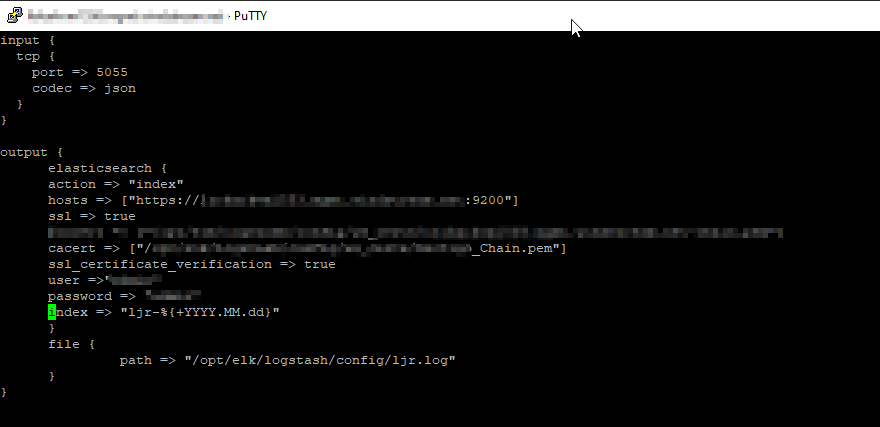
  1. The quickest thing to do is copy the config of a similar use case and adjusted the pipeline port (and adjusted the ES destination index). But, if this is a unique scenario, build a new pipeline configuration. I am creating a TCP listener that receives data from Python using the python-logstash module. In this configuration, logstash will create the index as needed with YYYY-MM-dd appended to the base index name.
    Text

Description automatically generated
  2. Edit the pipelines.yml to register the config you just created
  3. Restart logstash to activate the new pipeline
  4. Use netstat -nap | grep `pidof java` to ensure the server is listening on the new port
  5. Add the port to the runtime firewalld rules and test that the port is functional (firewall-cmd –zone=public –add-port=5055/tcp)
  6. Assuming the runtime rule has not had any unexpected results, register a permanent firewalld rule (firewall-cmd –permanent –zone=public –add-port=5055/tcp)

We now have a logstash data collector ready. We next need to create the index templates in ES

  1. Log into Kibana
  2. Create an ILM policy – this policy rolls indices into the warm phase after 2 days and forces merge. It also deletes records after 20 days.
    { “policy”: { “phases”: { “hot”: { “min_age”: “0ms”, “actions”: { “set_priority”: { “priority”: 100 } } }, “warm”: { “min_age”: “2d”, “actions”: { “forcemerge”: { “max_num_segments”: 1 }, “set_priority”: { “priority”: 50 } } }, “delete”: { “min_age”: “20d”, “actions”: { “delete”: {} } } } } }
  3. Create an index template — define the number of replicas
  4. Send data through the pipeline – the index will get created per the template definitions and document(s) added to the index