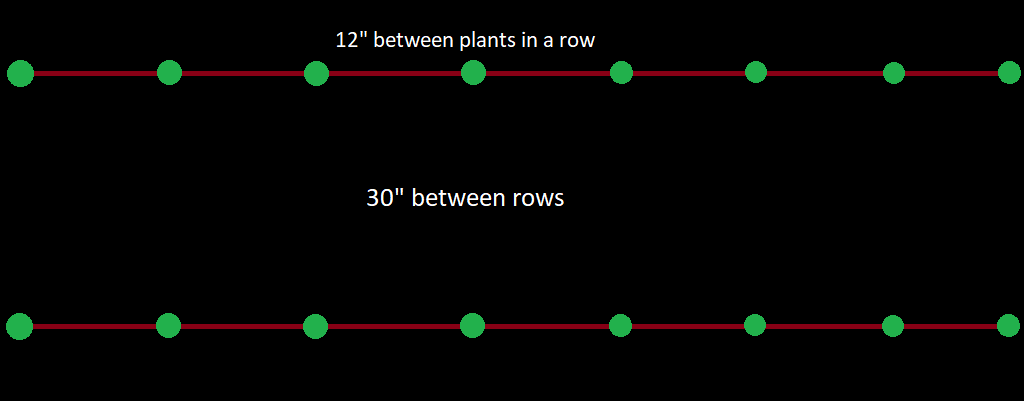
A note so we can (hopefully) avoid over-seeding corn in the future — we want to have a foot between the plants in each row and 30″ between rows. Scott’s seen between 20″ and 30″ row spacing — so we can go denser than this if we want to increase the number of plants.
Proto Hazelnuts
NEO4J: WITH and Scope
I have encountered another manual reading failure error — if you actually read the Cypher documentation for WITH, it clearly states that entering a WITH block creates a new scope into which previous variables are not imported. Unless you specifically include them. You can individually include variables in this new scope (WITH oldvariable1, oldvariable2, newSomething as newvariable1) or just use * to include all previous variables.
Doing neither will produce an error that a variable that you are absolutely positive exists does not, in fact, exist.
Proto-Hazelnuts (A few days later)
Unable to use JStat with Cassandra
We have been having some problems with a Cassandra cluster, so I wanted to look at the java heap space. Unfortunately, jstat cannot find the pid. And, yes, it is the right PID!
Looking in /tmp/hsperfdata_cassandra/, there’s no file! Reading through the whole line where Cassandra is running, I noticed +PerfDisableSharedMem … that’d do it!
It looks like they intentionally set +PerfDisableSharedMem in the Cassandra startup script. I assume their rational is still reasonable … so wouldn’t remove the parameter for day-to-day operation. But, when there’s a problem … restarting Cassandra without this parameter allows us to check how garbage collection is going.
Java Heap Stats with JStat
While there are plenty of third-party utilities for looking at the java heap space, I just use jstat (in OpenJDK, this means installing java-<Version>-openjdk-devel
JStat will display the following columns:
--------------------------------------------------------------------------------
S0C: Survivor space 0 size in K
S1C: Survivor space 1 size in K

S0U: Survivor space 0 usage in K
S1U: Survivor space 1 usage in K

--------------------------------------------------------------------------------

EC: Eden space size in K
EU: Eden space usage in K

--------------------------------------------------------------------------------

OC: Old space size in K
OU: Old space usage in K

--------------------------------------------------------------------------------

MC: Meta space size in K
MU: Meta space usage in K

--------------------------------------------------------------------------------

CCSC: CodeCache size in K
CCSU: CodeCache usage in K

--------------------------------------------------------------------------------

YGC: Young generation garbage collection count
YGCT: Young generation garbage collection total time in seconds

FGC: Full garbage collection count
FGCT: Full garbage collection total time in seconds

CGC: Concurrent garbage collection count
CGCT: Concurrent garbage collection time in seconds
GCT: Total garbage collection time in seconds

--------------------------------------------------------------------------------
https://stackoverflow.com/questions/13660871/jvm-garbage-collection-in-young-generation/13661014#13661014 does a good job of explaining the nomenclature & how stuff gets moved around in the heap space
Sample output — this command is for java PID 19356 and will list 100 lines 2 seconds apart (2000 ms)
server01:bin # jstat -gc 19356 2000 100
S0C S1C S0U S1U EC EU OC OU MC MU CCSC CCSU YGC YGCT FGC FGCT GCT
68096.0 68096.0 0.0 64207.5 545344.0 319007.2 30775744.0 19221750.2 137452.0 124322.4 18860.0 15380.6 324697 14589.985 228 45.830 14635.815
68096.0 68096.0 0.0 64207.5 545344.0 386674.5 30775744.0 19221750.2 137452.0 124322.4 18860.0 15380.6 324697 14589.985 228 45.830 14635.815
68096.0 68096.0 0.0 64207.5 545344.0 457055.4 30775744.0 19221750.2 137452.0 124322.4 18860.0 15380.6 324697 14589.985 228 45.830 14635.815
68096.0 68096.0 0.0 64207.5 545344.0 485538.8 30775744.0 19221750.2 137452.0 124322.4 18860.0 15380.6 324697 14589.985 228 45.830 14635.815
68096.0 68096.0 0.0 64207.5 545344.0 505893.4 30775744.0 19221750.2 137452.0 124322.4 18860.0 15380.6 324697 14589.985 228 45.830 14635.815
And this is a time where a third-party tool would be helpful but I never really ‘get’ what is and what is not OK to install on servers, so try not to install things — because the *useful* bit of information for any of this is really the usage / size percent utilization value.
That last grouping of stuff — I look at those v/s how long the pid has been running. If you’ve gotten a billion GC’s and the PID has only been running for eight seconds, that is a crazy amount of I/O. If I’ve only had 3 GCs and the pid has been running for seven years, it hasn’t been doing anything. In between? I don’t really find the numbers useful unless I’ve got a baseline from normal operation.
Proto-Hazelnuts
NEO4J: Deleting All Nodes and Relationships
Admittedly, this is not likely to be something you do a lot in production … but while playing around in a sandbox, I have found it useful to have a quick command to “empty” my database
MATCH (n)
DETACH DELETE n
Garlic Scapes
I harvested two large shopping bags stuffed with garlic scapes today. I’ll blanch and freeze a bunch; but, this year, I am going to try pickling some garlic scapes too.


