Tag: ElasticSearch

Logstash – Filtering data with Ruby

I’ve been working on forking log data into two different indices based on an element contained within the record — if the filename being sent includes the string “BASELINE”, then the data goes into the baseline index, otherwise it goes into the scan index. The data being ingested has the file name in “@fields.myfilename”
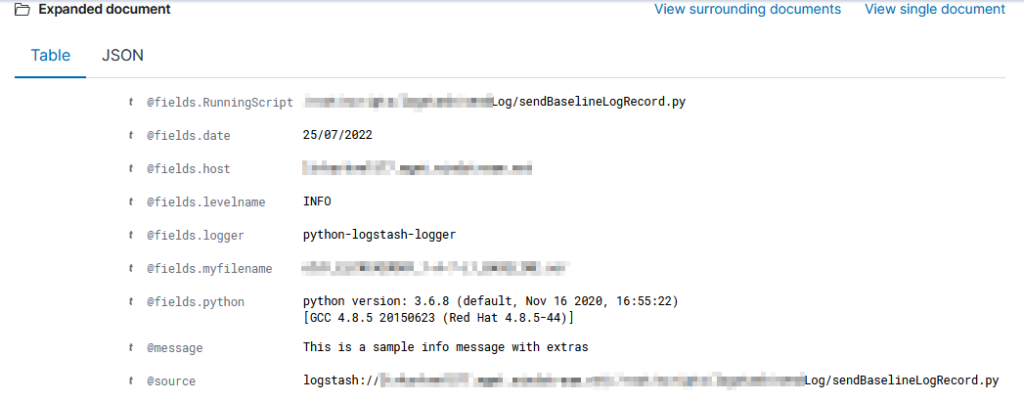
It took a while to figure out how to get the value from the current data — event.get(‘[@fields][myfilename]’) to get the @fields.myfilename value.

The following logstash config accepts JSON inputs, parses the underscore-delimited filename into fields, replaces the dashes with underscores as KDL doesn’t handle dashes and wildcards in searches, and adds a flag to any record that should be a baseline. In the output section, that flag is then used to publish data to the appropriate index based on the baseline flag value.

input {
  tcp {
    port => 5055
    codec => json
  }
}
filter {
        # Sample file name: scan_ABCDMIIWO0Y_1-A-5-L2_BASELINE.json
        ruby {  code => "
                        strfilename = event.get('[@fields][myfilename]')
                        arrayfilebreakout = strfilename.split('_')
                        event.set('hostname', arrayfilebreakout[1])
                        event.set('direction',arrayfilebreakout[2])
                        event.set('parseablehost', strfilename.gsub('-','_'))

                        if strfilename.downcase =~ /baseline/
                                event.set('baseline', 1)
                        end" }
}
output {
        if [baseline] == 1 {
                elasticsearch {
                        action => "index"
                        hosts => ["https://elastic.example.com:9200"]
                        ssl => true
                        cacert => ["/path/to/logstash/config/certs/My_Chain.pem"]
                        ssl_certificate_verification => true
                        # Credentials go here
                        index => "ljr-baselines"
                }
        }
        else{
              elasticsearch {
                        action => "index"
                        hosts => ["https://elastic.example.com:9200"]
                        ssl => true
                        cacert => ["/path/to/logstash/config/certs/My_Chain.pem"]
                        ssl_certificate_verification => true
                        # Credentials go here
                        index => "ljr-scans-%{+YYYY.MM.dd}"
                }
        }
}
Kibana Vega Chart with Query

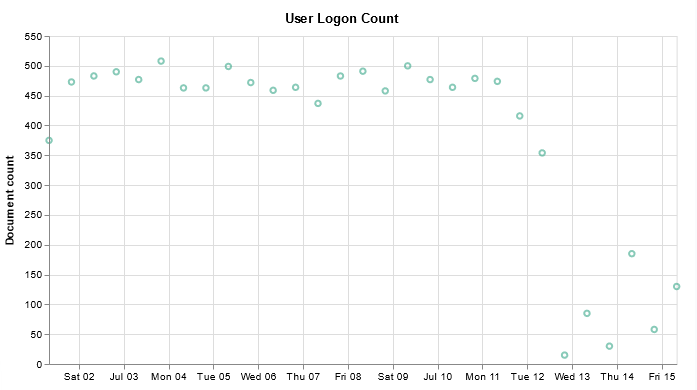
I have finally managed to produce a chart that includes a query — I don’t want to have to walk all of the help desk users through setting up the query, although I figured having the ability to select your own time range would be useful.

{
  $schema: https://vega.github.io/schema/vega-lite/v2.json
  title: User Logon Count

  // Define the data source
  data: {
    url: {
      // Which index to search
      index: firewall_logs*

      body: {
        _source: ['@timestamp', 'user', 'action']

"query": {
	"bool": {
		"must": [{
				"query_string": {
					"default_field": "subtype",
					"query": "user"
				}
			},
	   {
				"range": {
					"@timestamp": {
						"%timefilter%": true
                    			}
                  		}
     	}]
	}
}

        
        aggs: {
          time_buckets: {
            date_histogram: {
              field: @timestamp
              interval: {%autointerval%: true}
              extended_bounds: {
                // Use the current time range's start and end
                min: {%timefilter%: "min"}
                max: {%timefilter%: "max"}
              }
              // Use this for linear (e.g. line, area) graphs.  Without it, empty buckets will not show up
              min_doc_count: 0
            }
          }
        }
        size: 0
      }
    }
    format: {property: "aggregations.time_buckets.buckets"}
  }
  mark: point
  encoding: {
    x: {
      field: key
      type: temporal
      axis: {title: false} // Don't add title to x-axis
    }
    y: {
      field: doc_count
      type: quantitative
      axis: {title: "Document count"}
    }
  }
}

Kibana – Visualizations and Dashboards

Kibana – Creating Visualizations

General

Time Series Visualization Pipeline

Kibana – Creating a Dashboard

Kibana – Creating Visualizations

General

To create a new visualization, select the visualization icon from the left-hand navigation menu and click “Create visualization”. You’ll need to select the type of visualization you want to create.

TSVB (Time Series Visualization Builder)

The Time Series Visualization Pipeline is a GUI visualization builder to create graphs from time series data. This means the x-axis will be datetime values and the y-axis will the data you want to visualize over the time period. To create a new visualization of this type, select “TSVB” on the “New Visualization” menu.

Scroll down and select “Panel options” – here you specify the index you want to visualize. Select the field that will be used as the time for each document (e.g. if your document has a special field like eventOccuredAt, you’d select that here). I generally leave the time interval at ‘auto’ – although you might specifically want to present a daily or hourly report.

Once you have selected the index, return to the “Data” tab. First, select the type of aggregation you want to use. In this example, we are showing the number of documents for a variety of policies.

The “Group by” dropdown allows you to have chart lines for different categories (instead of just having the count of documents over the time series, which is what “Everything” produces) – to use document data to create the groupings, select “Terms”.

Select the field you want to group on – in this case, I want the count for each unique “policyname” value, so I selected “policyname.keyword” as the grouping term.

Voila – a time series chart showing how many documents are found for each policy name. Click “Save” at the top left of the chart to save the visualization.

Provide a name for the visualization, write a brief description, and click “Save”. The visualization will now be available for others to view or for inclusion in dashboards.

TimeLion

TimeLion looks like it is going away soon, but it’s what I’ve seen as the recommendation for drawing horizontal lines on charts.

This visualization type is a little cryptic – you need to enter Timelion expression — .es() retrieves data from ElasticSearch, .value(3500) draws a horizontal line at 3,500

If there is null data at a time value, TimeLion will draw a discontinuous line. You can modify this behavior by specifying a fit function.

Note that you’ll need to click “Update” to update the chart before you are able to save the visualization.

Vega

Vega is an experimental visualization type.

This is, by far, the most flexible but most complex approach to creating a visualization. I’ve used it to create the Sankey visualization showing the source and destination countries from our firewall logs. Both Vega and Vega-Lite grammars can be used. ElasticCo provides a getting started guide, and there are many example online that you can use as the basis for your visualization.

Kibana – Creating a Dashboard

To create a dashboard, select the “Dashboards” icon on the left-hand navigation bar. Click “Create dashboard”

Click “Add an existing” to add existing visualizations to the dashboard.

Select the dashboards you want added, then click “Save” to save your dashboard.

Provide a name and brief description, then click “Save”.


ElasticSearch – Deleting Documents by Criterion

We have an index that was created without a lifecycle policy — and it’s taking up about 300GB of our 1.5T on the dev server. I don’t want to delete it — mostly because I don’t know why it’s there. But cleaning up old data seemed like a

POST /metricbeat_kafka-/_delete_by_query
{
  "query": {
    "range" : {
        "@timestamp" : {
            "lte" : "2021-02-04T01:47:44.880Z"
        }
    }
  }
}

ElasticSearch Search API – Script Fields

I’ve been playing around with script fields to manipulate data returned by ElasticSearch queries. As an example, data where there are a few nested objects with values that need to be multiplied together:

{
	"order": {
		"item1": {
			"cost": 31.55,
			"count": 111
		},
		"item2": {
			"cost": 62.55,
			"count": 222
		},
		"item3": {
			"cost": 93.55,
			"count": 333
		}
	}
}

And to retrieve records and multiply cost by count:

{
  "query"  : { "match_all" : {} },
	"_source": ["order.item*.item", "order.item*.count", "order.item*.cost"],
  "script_fields" : {
    "total_cost_1" : {
      "script" : 
      {
        "lang": "painless",
        "source": "return doc['order.item1.cost'].value * doc['order.item1.count'].value;"
      }
    },
    "total_cost_2" : {
      "script" : 
      {
        "lang": "painless",
        "source": "return doc['order.item2.cost'].value * doc['order.item2.count'].value;"
      }
    },
    "total_cost_3" : {
      "script" : 
      {
        "lang": "painless",
        "source": "return doc['order.item3.cost'].value * doc['order.item3.count'].value;"
      }
    }    
  }
}

Unfortunately, I cannot find any way to iterate across an arbitrary number of item# objects nested in the order object. So, for now, I think the data manipulation will be done in the program using the API to retrieve data. Still, it was good to learn how to address values in the doc record.

Upgrading Logstash

The process to upgrade minor releases of LogStash is quite simple — stop service, drop the binaries in place, and start service. In this case, my upgrade process is slightly complicated by the fact our binaries aren’t installed to the “normal” location from the RPM. I am upgrading from 7.7.0 => 7.17.4

The first step is, obviously, to download the LogStash release you want – in this case, it is 7.17.4 as upgrading across major releases is not supported.


cd /tmp
mkdir logstash
mv logstash-7.17.4-x86_64.rpm ./logstash

cd /tmp/logstash
rpm2cpio logstash-7.17.4-x86_64.rpm | cpio -idmv

systemctl stop logstash
mv /opt/elk/logstash /opt/elk/logstash-7.7.0
mv /tmp/logstash/usr/share/logstash /opt/elk/
mkdir /var/log/logstash
mkdir /var/lib/logstash

mv /tmp/logstash/etc/logstash /etc/logstash
cd /etc/logstash
mkdir rpmnew
mv jvm.options ./rpmnew/
mv log* ./rpmnew/
mv pipelines.yml ./rpmnew/
mv startup.options ./rpmnew/
cp -r /opt/elk/logstash-7.7.0/config/* ./

ln -s /opt/elk/logstash /usr/share/logstash
ln -s /etc/logstash /opt/elk/logstash/config

chown -R elasticsearch:elasticsearch /opt/elk/logstash
chown -R elasticsearch:elasticsearch /var/log/logstash
chown -R elasticsearch:elasticsearch /var/lib/logstash
chown -R elasticsearch:elasticsearch /etc/logstash

systemctl start logstash
systemctl status logstash
/opt/elk/logstash/bin/logstash --version

Using FileBeat to Send Data to ElasticSearch via Logstash

Before sending data, you need a pipleline on logstash to accept the data. If you are using an existing pipeline, you just need the proper host and port for the pipeline to use in the Filebeat configuration. If you need a new pipeline, the input needs to be of type ‘beats’

# Sample Pipeline Config:
input {
  beats   {
    host => "logstashserver.example.com"
    port => 5057
    client_inactivity_timeout => "3000"
  }
}

filter {
  grok{
     match => {"message"=>"\[%{TIMESTAMP_ISO8601:timestamp}] %{DATA:LOGLEVEL} \[Log partition\=%{DATA:LOGPARTITION}, dir\=%{DATA:KAFKADIR}\] %{DATA:MESSAGE} \(%{DATA:LOGSOURCE}\)"}
  }
}

output {
  elasticsearch {
    action => "index"
    hosts => ["https://eshost.example.com:9200"]
    ssl => true
    cacert => ["/path/to/certs/CA_Chain.pem"]
    ssl_certificate_verification => true
    user =>"us3r1d"
    password => "p@s5w0rd"
    index => "ljrkafka-%{+YYYY.MM.dd}"
  }
}


Download the appropriate version from https://www.elastic.co/downloads/past-releases#filebeat – I am currently using 7.17.4 as we have a few CentOS + servers.

Install the package (rpm -ihv filebeat-7.17.4-x86_64.rpm) – the installation package places the configuration files in /etc/filebeat and the binaries and other “stuff” in /usr/share/filebeat

Edit /etc/filebeat/filebeat.yml

    • Add inputs for log paths you want to monitor (this may be done under the module config if using a module config instead)
    • Add an output for Logstash to the appropriate port for your pipeline:
      output.logstash:
      hosts: [“logstashhost.example.com:5055”]

Run filebeat in debug mode from the command line and watch for success or failure.
filebeat -e -c /etc/filebeat/filebeat.yml -d "*"

Assuming everything is running well, use systemctl start filebeat to run the service and systemctl enable filebeat to set it to launch on boot.

Filebeats will attempt to parse the log data and send a JSON object to the LogStash server. When you view the record in Kibana, you should see any fields parsed out with your grok rule – in this case, we have KAFKADIR, LOGLEVEL, LOGPARTITION, LOGSOURCE, and MESSAGE fields.

Using Logstash to Send Data to ElasticSearch

Create a logstash pipeline

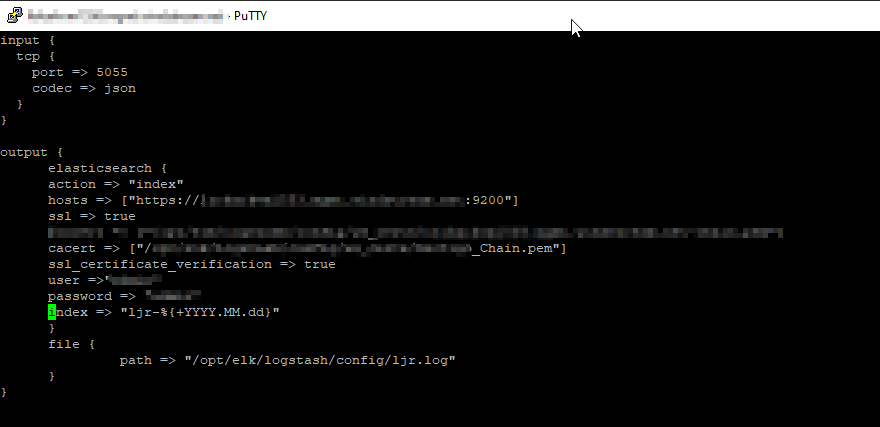
  1. The quickest thing to do is copy the config of a similar use case and adjusted the pipeline port (and adjusted the ES destination index). But, if this is a unique scenario, build a new pipeline configuration. I am creating a TCP listener that receives data from Python using the python-logstash module. In this configuration, logstash will create the index as needed with YYYY-MM-dd appended to the base index name.
    Text

Description automatically generated
  2. Edit the pipelines.yml to register the config you just created
  3. Restart logstash to activate the new pipeline
  4. Use netstat -nap | grep `pidof java` to ensure the server is listening on the new port
  5. Add the port to the runtime firewalld rules and test that the port is functional (firewall-cmd –zone=public –add-port=5055/tcp)
  6. Assuming the runtime rule has not had any unexpected results, register a permanent firewalld rule (firewall-cmd –permanent –zone=public –add-port=5055/tcp)

We now have a logstash data collector ready. We next need to create the index templates in ES

  1. Log into Kibana
  2. Create an ILM policy – this policy rolls indices into the warm phase after 2 days and forces merge. It also deletes records after 20 days.
    { “policy”: { “phases”: { “hot”: { “min_age”: “0ms”, “actions”: { “set_priority”: { “priority”: 100 } } }, “warm”: { “min_age”: “2d”, “actions”: { “forcemerge”: { “max_num_segments”: 1 }, “set_priority”: { “priority”: 50 } } }, “delete”: { “min_age”: “20d”, “actions”: { “delete”: {} } } } } }
  3. Create an index template — define the number of replicas
  4. Send data through the pipeline – the index will get created per the template definitions and document(s) added to the index


ELK Monitoring

We have a number of logstash servers gathering data from various filebeat sources. We’ve recently experienced a problem where the pipeline stops getting data for some of those sources. Not all — and restarting the non-functional filebeat source sends data for ten minutes or so. We were able to rectify the immediate problem by restarting our logstash services (IT troubleshooting step #1 — we restarted all of the filebeats and, when that didn’t help, moved on to restarting the logstashes)

But we need to have a way to ensure this isn’t happening — losing days of log data from some sources is really bad. So I put together a Python script to verify there’s something coming in from each of the filebeat sources.

pip install elasticsearch==7.13.4

#!/usr/bin/env python3
#-*- coding: utf-8 -*-
# Disable warnings that not verifying SSL trust isn't a good idea
import requests
requests.packages.urllib3.disable_warnings()

from elasticsearch import Elasticsearch
import time

# Modules for email alerting
import smtplib
from email.mime.multipart import MIMEMultipart
from email.mime.text import MIMEText


# Config variables
strSenderAddress = "devnull@example.com"
strRecipientAddress = "me@example.com"
strSMTPHostname = "mail.example.com"
iSMTPPort = 25

listSplunkRelayHosts = ['host293', 'host590', 'host591', 'host022', 'host014', 'host135']
iAgeThreashold = 3600 # Alert if last document is more than an hour old (3600 seconds)

strAlert = None

for strRelayHost in listSplunkRelayHosts:
	iCurrentUnixTimestamp = time.time()
	elastic_client = Elasticsearch("https://elasticsearchhost.example.com:9200", http_auth=('rouser','r0pAs5w0rD'), verify_certs=False)

	query_body = {
		"sort": {
			"@timestamp": {
				"order": "desc"
			}
		},
		"query": {
			"bool": {
				"must": {
					"term": {
						"host.hostname": strRelayHost
					}
				},
				"must_not": {
					"term": {
						"source": "/var/log/messages"
					}
				}
			}
		}
	}

	result = elastic_client.search(index="network_syslog*", body=query_body,size=1)
	all_hits = result['hits']['hits']

	iDocumentAge = None
	for num, doc in enumerate(all_hits):
		iDocumentAge =  (  (iCurrentUnixTimestamp*1000) - doc.get('sort')[0]) / 1000.0

	if iDocumentAge is not None:
		if iDocumentAge > iAgeThreashold:
			if strAlert is None:
				strAlert = f"<tr><td>{strRelayHost}</td><td>{iDocumentAge}</td></tr>"
			else:
				strAlert = f"{strAlert}\n<tr><td>{strRelayHost}</td><td>{iDocumentAge}</td></tr>\n"
			print(f"PROBLEM - For {strRelayHost}, document age is {iDocumentAge} second(s)")
		else:
			print(f"GOOD - For {strRelayHost}, document age is {iDocumentAge} second(s)")
	else:
		print(f"PROBLEM - For {strRelayHost}, no recent record found")


if strAlert is not None:
	msg = MIMEMultipart('alternative')
	msg['Subject'] = "ELK Filebeat Alert"
	msg['From'] = strSenderAddress
	msg['To'] = strRecipientAddress

	strHTMLMessage = f"<html><body><table><tr><th>Server</th><th>Document Age</th></tr>{strAlert}</table></body></html>"
	strTextMessage = strAlert

	part1 = MIMEText(strTextMessage, 'plain')
	part2 = MIMEText(strHTMLMessage, 'html')

	msg.attach(part1)
	msg.attach(part2)

	s = smtplib.SMTP(strSMTPHostname)
	s.sendmail(strSenderAddress, strRecipientAddress, msg.as_string())
	s.quit()