Tag: FileBeat

Using FileBeat to Send Data to ElasticSearch via Logstash

Before sending data, you need a pipleline on logstash to accept the data. If you are using an existing pipeline, you just need the proper host and port for the pipeline to use in the Filebeat configuration. If you need a new pipeline, the input needs to be of type ‘beats’

# Sample Pipeline Config:
input {
  beats   {
    host => "logstashserver.example.com"
    port => 5057
    client_inactivity_timeout => "3000"
  }
}

filter {
  grok{
     match => {"message"=>"\[%{TIMESTAMP_ISO8601:timestamp}] %{DATA:LOGLEVEL} \[Log partition\=%{DATA:LOGPARTITION}, dir\=%{DATA:KAFKADIR}\] %{DATA:MESSAGE} \(%{DATA:LOGSOURCE}\)"}
  }
}

output {
  elasticsearch {
    action => "index"
    hosts => ["https://eshost.example.com:9200"]
    ssl => true
    cacert => ["/path/to/certs/CA_Chain.pem"]
    ssl_certificate_verification => true
    user =>"us3r1d"
    password => "p@s5w0rd"
    index => "ljrkafka-%{+YYYY.MM.dd}"
  }
}


Download the appropriate version from https://www.elastic.co/downloads/past-releases#filebeat – I am currently using 7.17.4 as we have a few CentOS + servers.

Install the package (rpm -ihv filebeat-7.17.4-x86_64.rpm) – the installation package places the configuration files in /etc/filebeat and the binaries and other “stuff” in /usr/share/filebeat

Edit /etc/filebeat/filebeat.yml

    • Add inputs for log paths you want to monitor (this may be done under the module config if using a module config instead)
    • Add an output for Logstash to the appropriate port for your pipeline:
      output.logstash:
      hosts: [“logstashhost.example.com:5055”]

Run filebeat in debug mode from the command line and watch for success or failure.
filebeat -e -c /etc/filebeat/filebeat.yml -d "*"

Assuming everything is running well, use systemctl start filebeat to run the service and systemctl enable filebeat to set it to launch on boot.

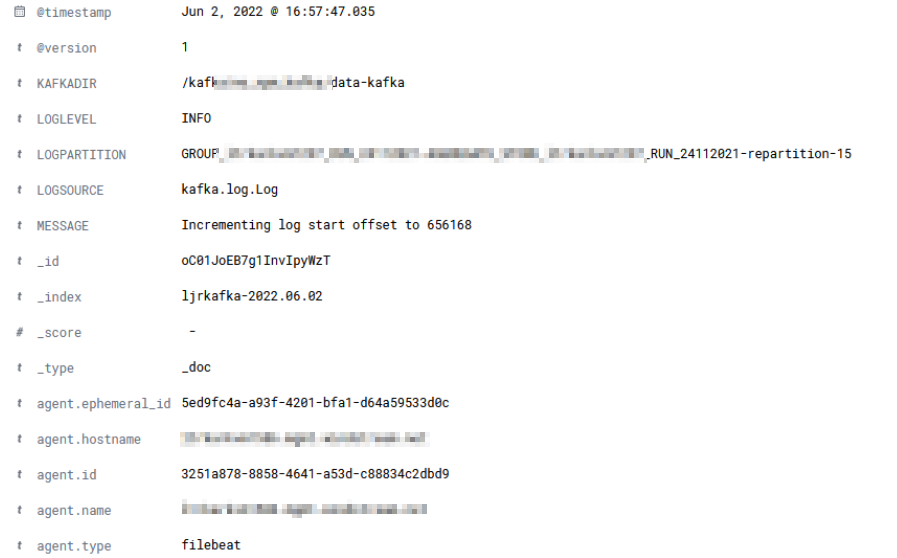
Filebeats will attempt to parse the log data and send a JSON object to the LogStash server. When you view the record in Kibana, you should see any fields parsed out with your grok rule – in this case, we have KAFKADIR, LOGLEVEL, LOGPARTITION, LOGSOURCE, and MESSAGE fields.
ELK Monitoring

We have a number of logstash servers gathering data from various filebeat sources. We’ve recently experienced a problem where the pipeline stops getting data for some of those sources. Not all — and restarting the non-functional filebeat source sends data for ten minutes or so. We were able to rectify the immediate problem by restarting our logstash services (IT troubleshooting step #1 — we restarted all of the filebeats and, when that didn’t help, moved on to restarting the logstashes)

But we need to have a way to ensure this isn’t happening — losing days of log data from some sources is really bad. So I put together a Python script to verify there’s something coming in from each of the filebeat sources.

pip install elasticsearch==7.13.4

#!/usr/bin/env python3
#-*- coding: utf-8 -*-
# Disable warnings that not verifying SSL trust isn't a good idea
import requests
requests.packages.urllib3.disable_warnings()

from elasticsearch import Elasticsearch
import time

# Modules for email alerting
import smtplib
from email.mime.multipart import MIMEMultipart
from email.mime.text import MIMEText


# Config variables
strSenderAddress = "devnull@example.com"
strRecipientAddress = "me@example.com"
strSMTPHostname = "mail.example.com"
iSMTPPort = 25

listSplunkRelayHosts = ['host293', 'host590', 'host591', 'host022', 'host014', 'host135']
iAgeThreashold = 3600 # Alert if last document is more than an hour old (3600 seconds)

strAlert = None

for strRelayHost in listSplunkRelayHosts:
	iCurrentUnixTimestamp = time.time()
	elastic_client = Elasticsearch("https://elasticsearchhost.example.com:9200", http_auth=('rouser','r0pAs5w0rD'), verify_certs=False)

	query_body = {
		"sort": {
			"@timestamp": {
				"order": "desc"
			}
		},
		"query": {
			"bool": {
				"must": {
					"term": {
						"host.hostname": strRelayHost
					}
				},
				"must_not": {
					"term": {
						"source": "/var/log/messages"
					}
				}
			}
		}
	}

	result = elastic_client.search(index="network_syslog*", body=query_body,size=1)
	all_hits = result['hits']['hits']

	iDocumentAge = None
	for num, doc in enumerate(all_hits):
		iDocumentAge =  (  (iCurrentUnixTimestamp*1000) - doc.get('sort')[0]) / 1000.0

	if iDocumentAge is not None:
		if iDocumentAge > iAgeThreashold:
			if strAlert is None:
				strAlert = f"<tr><td>{strRelayHost}</td><td>{iDocumentAge}</td></tr>"
			else:
				strAlert = f"{strAlert}\n<tr><td>{strRelayHost}</td><td>{iDocumentAge}</td></tr>\n"
			print(f"PROBLEM - For {strRelayHost}, document age is {iDocumentAge} second(s)")
		else:
			print(f"GOOD - For {strRelayHost}, document age is {iDocumentAge} second(s)")
	else:
		print(f"PROBLEM - For {strRelayHost}, no recent record found")


if strAlert is not None:
	msg = MIMEMultipart('alternative')
	msg['Subject'] = "ELK Filebeat Alert"
	msg['From'] = strSenderAddress
	msg['To'] = strRecipientAddress

	strHTMLMessage = f"<html><body><table><tr><th>Server</th><th>Document Age</th></tr>{strAlert}</table></body></html>"
	strTextMessage = strAlert

	part1 = MIMEText(strTextMessage, 'plain')
	part2 = MIMEText(strHTMLMessage, 'html')

	msg.attach(part1)
	msg.attach(part2)

	s = smtplib.SMTP(strSMTPHostname)
	s.sendmail(strSenderAddress, strRecipientAddress, msg.as_string())
	s.quit()

Debugging Filebeat

# Run filebeat from the command line and add debugging flags to increase verbosity of output
# -e directs output to STDERR instead of syslog
# -c indicates the config file to use
# -d indicates which debugging items you want -- * for all
/opt/filebeat/filebeat -e -c /opt/filebeat/filebeat.yml -d "*"

Python Logging to Logstash Server

Since we are having a problem with some of our filebeat servers actually delivering data over to logstash, I put together a really quick python script that connects to the logstash server and sends a log record. I can then run tcpdump on the logstash server and hopefully see what is going wrong.

import logging
import logstash
import sys

strHost = 'logstash.example.com'
iPort = 5048

test_logger = logging.getLogger('python-logstash-logger')
test_logger.setLevel(logging.INFO)
test_logger.addHandler(logstash.TCPLogstashHandler(host=strHost,port=iPort))

test_logger.info('May 22 23:34:13 ABCDOHEFG66SC03 sipd[3863cc60] CRITICAL One or more Dns Servers are currently unreachable!')
test_logger.warning('May 22 23:34:13 ABCDOHEFG66SC03 sipd[3863cc60] CRITICAL One or more Dns Servers are currently unreachable!')
test_logger.error('May 22 23:34:13 ABCDOHEFG66SC03 sipd[3863cc60] CRITICAL One or more Dns Servers are currently unreachable!')