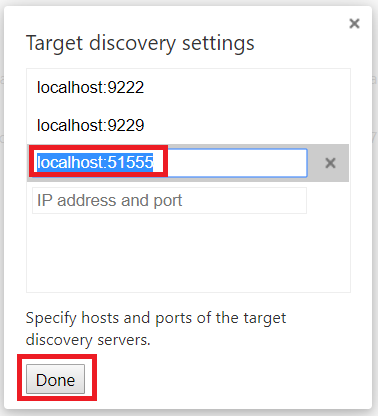
The Teams desktop client is an Electron application – which means you can debug the Teams client just like any other Electron application. To set up debugging through Chrome, open Chrome to chrome://inspect Configure network targets. Click “Configure”

Add an unused port to be used for Teams debugging.

Run Teams with the remote debugging flag port set to the same port you added above. E.g.
%userprofile%\AppData\Local\Microsoft\Teams\current\Teams.exe –remote-debugging-port=51555
Now you’ve got access to the Electron app in Chrome. Click on “Inspect” for the thread you want to watch

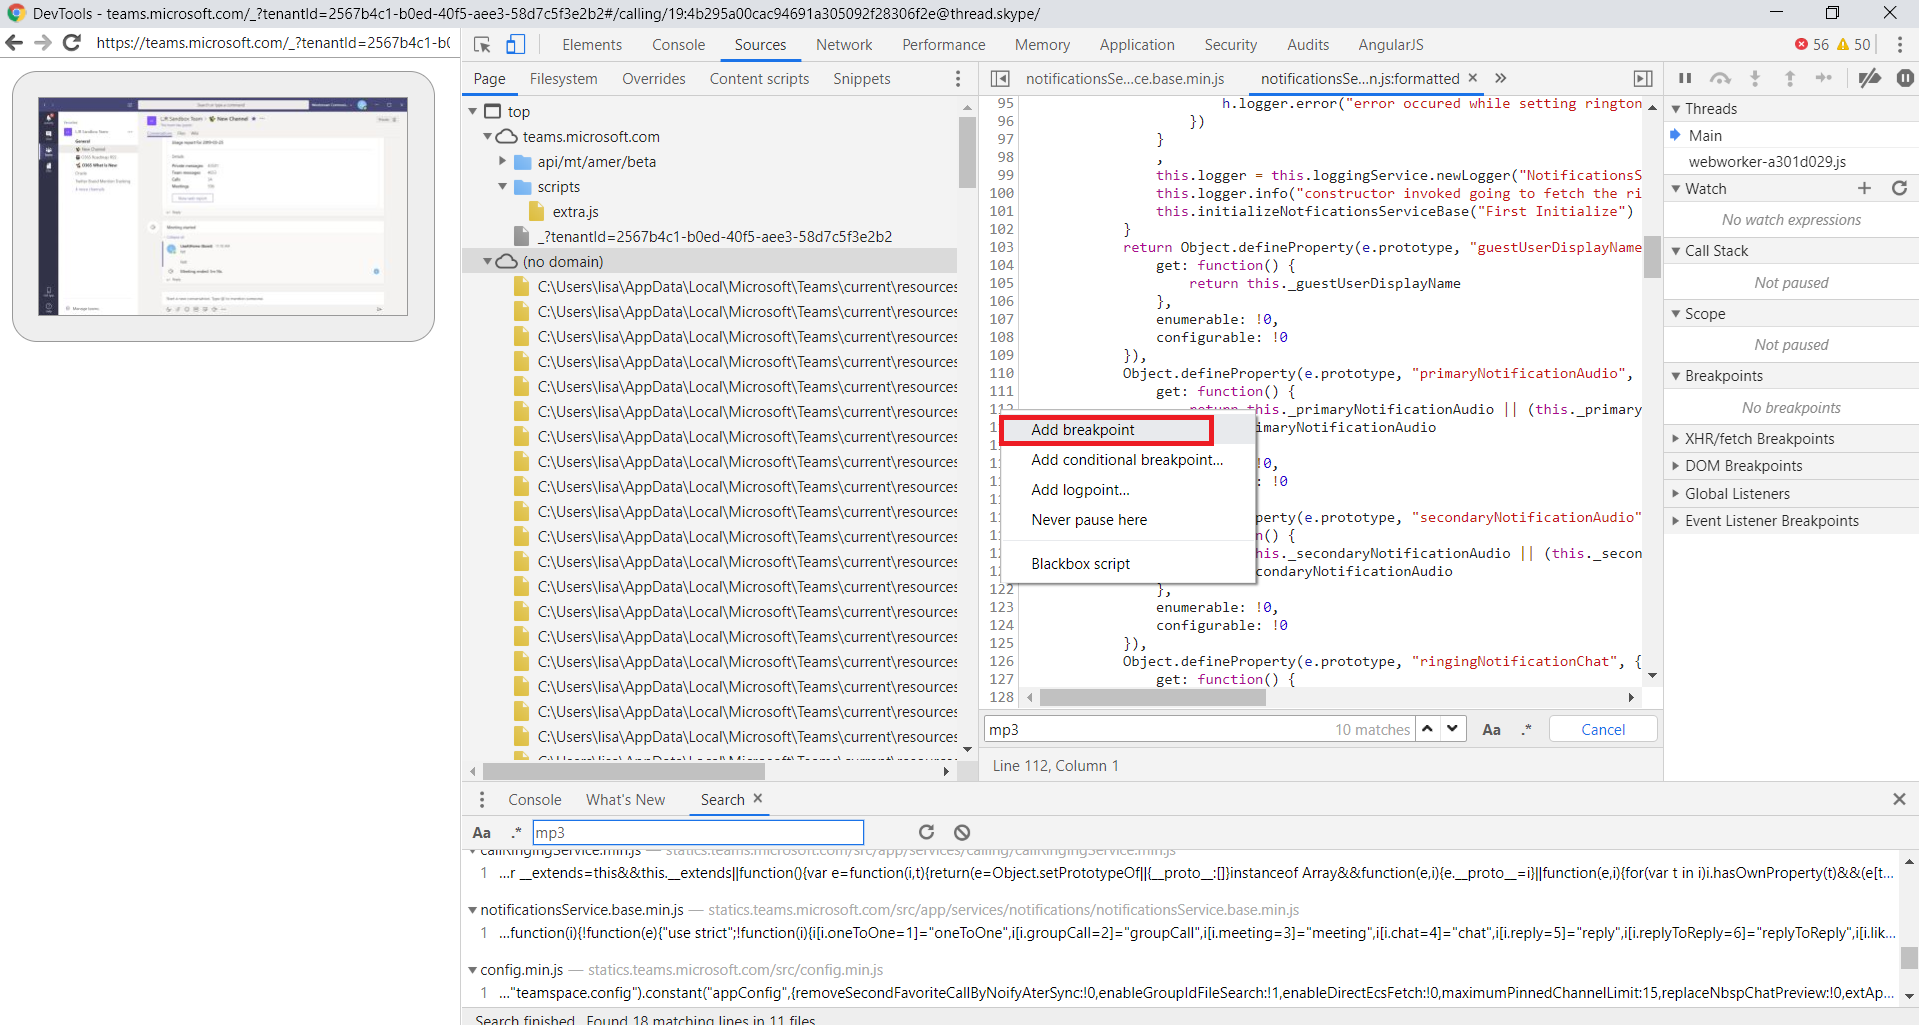
You can add break-points in the code to pause program execution.

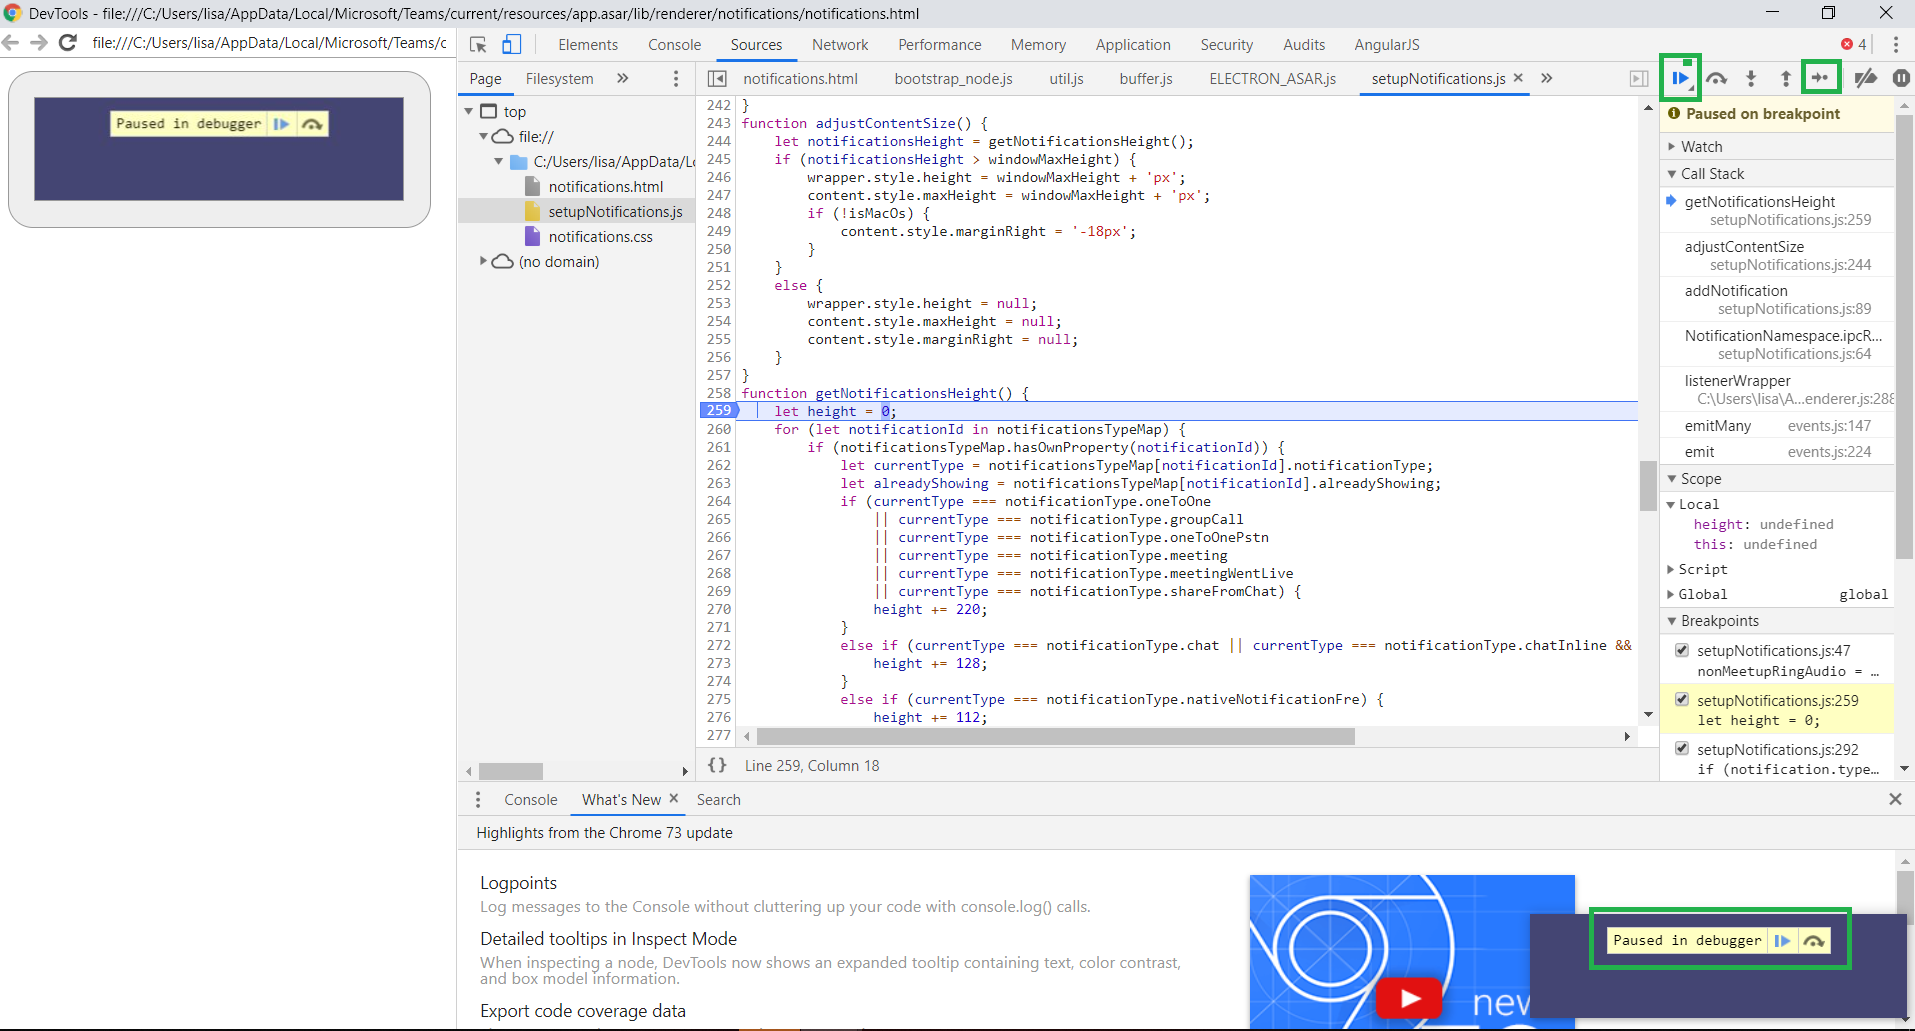
You’ll see a “Paused in debugger” indicator when a breakpoint is reached. You can resume or step over using this indicator, or you can use the DevTools debugger – the DevTools debugger also allows you to proceed one step at a time through program execution (F9).

Through the debugger, I was able to identify the source of the weak little notification ding

https://statics.teams.microsoft.com/hashedassets/audio/Teams_Notification_Secondary-a8621153.mp3
Which means I can redirect this URL … really anything that matches the URL up through Teams_Notification because I expect the alpha-numeric at the end to change and I’m sure there’s a primary notification 😊 … and make the notification noticeable.
Looking through the package, I see eighteen different ‘ringtone’ type MP3 files, and only three lines of code that use them. Hopefully this is an indicator that MS has begun development of some user-selectable notification sounds in the desktop client.
nonMeetupRingAudio = new Audio(data.assetsPath + ‘audio/ring.mp3’);
meetupRingAudio = new Audio(data.assetsPath + ‘audio/meetup_ring.mp3’);
screenshareRingAudio = new Audio(data.assetsPath + ‘audio/screenshare_ring.mp3’);