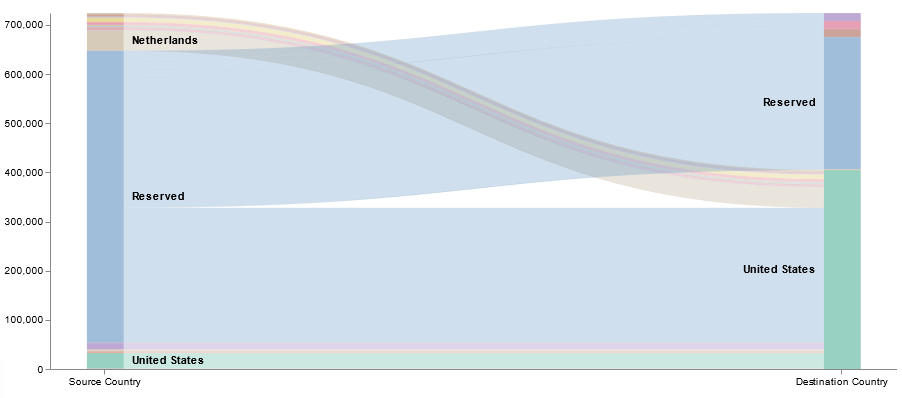
Now that we’ve got a lot of data being ingested into our ELK platform, I am beginning to build out visualizations and dashboards. This Vega visualization (source below) shows the number of connections between source and destination countries.

{
  $schema: https://vega.github.io/schema/vega/v3.0.json
  data: [
    {
      // Respect currently selected time range and filter string
      name: rawData
      url: {
        %context%: true
        %timefield%: @timestamp
        index: firewall_logs*
        body: {
          size: 0
          aggs: {
            table: {
              composite: {
                size: 10000
                sources: [
                  {
                    source_country: {
                     terms: {field: "srccountry.keyword"}
                    }
                  }
                  {
                    dest_country: {
                     terms: {field: "dstcountry.keyword"}
                    }
                  }
                ]
              }
            }
          }
        }
      }
      format: {property: "aggregations.table.buckets"}
      // Add aliases for data.* elements
      transform: [
        {type: "formula", expr: "datum.key.source_country", as: "source_country"}
        {type: "formula", expr: "datum.key.dest_country", as: "dest_country"}
        {type: "formula", expr: "datum.doc_count", as: "size"}
      ]
    }
    {
      name: nodes
      source: rawData
      transform: [
        // Filter to selected country
        {
          type: filter
          expr: !groupSelector || groupSelector.source_country == datum.source_country || groupSelector.dest_country == datum.dest_country
        }
        {type: "formula", expr: "datum.source_country+datum.dest_country", as: "key"}
        {
          type: fold
          fields: ["source_country", "dest_country"]
          as: ["stack", "grpId"]
        }
        {
          type: formula
          expr: datum.stack == 'source_country' ? datum.source_country+' '+datum.dest_country : datum.dest_country+' '+datum.source_country
          as: sortField
        }
        {
          type: stack
          groupby: ["stack"]
          sort: {field: "sortField", order: "descending"}
          field: size
        }
        {type: "formula", expr: "(datum.y0+datum.y1)/2", as: "yc"}
      ]
    }
    {
      name: groups
      source: nodes
      transform: [
        // Aggregate country groups and include number of documents for each grouping
        {
          type: aggregate
          groupby: ["stack", "grpId"]
          fields: ["size"]
          ops: ["sum"]
          as: ["total"]
        }
        {
          type: stack
          groupby: ["stack"]
          sort: {field: "grpId", order: "descending"}
          field: total
        }
        {type: "formula", expr: "scale('y', datum.y0)", as: "scaledY0"}
        {type: "formula", expr: "scale('y', datum.y1)", as: "scaledY1"}
        {type: "formula", expr: "datum.stack == 'source_country'", as: "rightLabel"}
        {
          type: formula
          expr: datum.total/domain('y')[1]
          as: percentage
        }
      ]
    }
    {
      name: destinationNodes
      source: nodes
      transform: [
        {type: "filter", expr: "datum.stack == 'dest_country'"}
      ]
    }
    {
      name: edges
      source: nodes
      transform: [
        {type: "filter", expr: "datum.stack == 'source_country'"}
        {
          type: lookup
          from: destinationNodes
          key: key
          fields: ["key"]
          as: ["target"]
        }
        {
          type: linkpath
          orient: horizontal
          shape: diagonal
          sourceY: {expr: "scale('y', datum.yc)"}
          sourceX: {expr: "scale('x', 'source_country') + bandwidth('x')"}
          targetY: {expr: "scale('y', datum.target.yc)"}
          targetX: {expr: "scale('x', 'dest_country')"}
        }
        // Calculation to determine line thickness
        {
          type: formula
          expr: range('y')[0]-scale('y', datum.size)
          as: strokeWidth
        }
        {
          type: formula
          expr: datum.size/domain('y')[1]
          as: percentage
        }
      ]
    }
  ]
  scales: [
    {
      name: x
      type: band
      range: width
      domain: ["source_country", "dest_country"]
      paddingOuter: 0.05
      paddingInner: 0.95
    }
    {
      name: y
      type: linear
      range: height
      domain: {data: "nodes", field: "y1"}
    }
    {
      name: color
      type: ordinal
      range: category
      domain: {data: "rawData", fields: ["source_country", "dest_country"]}
    }
    {
      name: stackNames
      type: ordinal
      range: ["Source Country", "Destination Country"]
      domain: ["source_country", "dest_country"]
    }
  ]
  axes: [
    {
      orient: bottom
      scale: x
      encode: {
        labels: {
          update: {
            text: {scale: "stackNames", field: "value"}
          }
        }
      }
    }
    {orient: "left", scale: "y"}
  ]
  marks: [
    {
      type: path
      name: edgeMark
      from: {data: "edges"}
      clip: true
      encode: {
        update: {
          stroke: [
            {
              test: groupSelector && groupSelector.stack=='source_country'
              scale: color
              field: dest_country
            }
            {scale: "color", field: "source_country"}
          ]
          strokeWidth: {field: "strokeWidth"}
          path: {field: "path"}
          strokeOpacity: {
            signal: !groupSelector && (groupHover.source_country == datum.source_country || groupHover.dest_country == datum.dest_country) ? 0.9 : 0.3
          }
          zindex: {
            signal: !groupSelector && (groupHover.source_country == datum.source_country || groupHover.dest_country == datum.dest_country) ? 1 : 0
          }
          tooltip: {
            signal: datum.source_country + ' → ' + datum.dest_country + '    ' + format(datum.size, ',.0f') + '   (' + format(datum.percentage, '.1%') + ')'
          }
        }
        hover: {
          strokeOpacity: {value: 1}
        }
      }
    }
    {
      type: rect
      name: groupMark
      from: {data: "groups"}
      encode: {
        enter: {
          fill: {scale: "color", field: "grpId"}
          width: {scale: "x", band: 1}
        }
        update: {
          x: {scale: "x", field: "stack"}
          y: {field: "scaledY0"}
          y2: {field: "scaledY1"}
          fillOpacity: {value: 0.6}
          tooltip: {
            signal: datum.grpId + '   ' + format(datum.total, ',.0f') + '   (' + format(datum.percentage, '.1%') + ')'
          }
        }
        hover: {
          fillOpacity: {value: 1}
        }
      }
    }
    {
      type: text
      from: {data: "groups"}
      interactive: false
      encode: {
        update: {
          x: {
            signal: scale('x', datum.stack) + (datum.rightLabel ? bandwidth('x') + 8 : -8)
          }
          yc: {signal: "(datum.scaledY0 + datum.scaledY1)/2"}
          align: {signal: "datum.rightLabel ? 'left' : 'right'"}
          baseline: {value: "middle"}
          fontWeight: {value: "bold"}
          // Do not show labels on smaller items
          text: {signal: "abs(datum.scaledY0-datum.scaledY1) > 13 ? datum.grpId : ''"}
        }
      }
    }
    {
      type: group
      data: [
        {
          name: dataForShowAll
          values: [{}]
          transform: [{type: "filter", expr: "groupSelector"}]
        }
      ]
      // Set button size and positioning
      encode: {
        enter: {
          xc: {signal: "width/2"}
          y: {value: 30}
          width: {value: 80}
          height: {value: 30}
        }
      }
      marks: [
        {
          type: group
          name: groupReset
          from: {data: "dataForShowAll"}
          encode: {
            enter: {
              cornerRadius: {value: 6}
              fill: {value: "#f5f5f5"}
              stroke: {value: "#c1c1c1"}
              strokeWidth: {value: 2}
              // use parent group's size
              height: {
                field: {group: "height"}
              }
              width: {
                field: {group: "width"}
              }
            }
            update: {
              opacity: {value: 1}
            }
            hover: {
              opacity: {value: 0.7}
            }
          }
          marks: [
            {
              type: text
              interactive: false
              encode: {
                enter: {
                  xc: {
                    field: {group: "width"}
                    mult: 0.5
                  }
                  yc: {
                    field: {group: "height"}
                    mult: 0.5
                    offset: 2
                  }
                  align: {value: "center"}
                  baseline: {value: "middle"}
                  fontWeight: {value: "bold"}
                  text: {value: "Show All"}
                }
              }
            }
          ]
        }
      ]
    }
  ]
  signals: [
    {
      name: groupHover
      value: {}
      on: [
        {
          events: @groupMark:mouseover
          update: "{source_country:datum.stack=='source_country' && datum.grpId, dest_country:datum.stack=='dest_country' && datum.grpId}"
        }
        {events: "mouseout", update: "{}"}
      ]
    }
    {
      name: groupSelector
      value: false
      on: [
        {
          events: @groupMark:click!
          update: "{stack:datum.stack, source_country:datum.stack=='source_country' && datum.grpId, dest_country:datum.stack=='dest_country' && datum.grpId}"
        }
        {
          events: [
            {type: "click", markname: "groupReset"}
            {type: "dblclick"}
          ]
          update: "false"
        }
      ]
    }
  ]
}