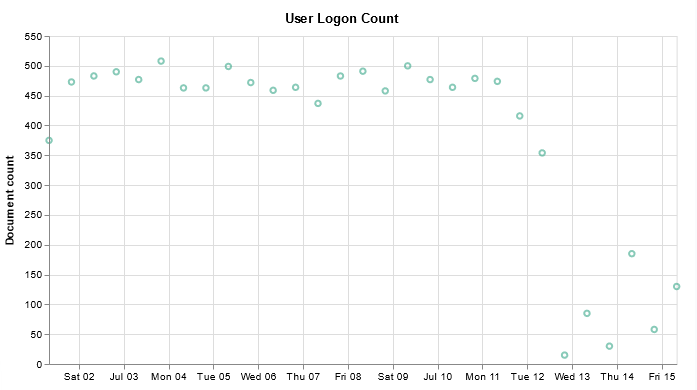
I have finally managed to produce a chart that includes a query — I don’t want to have to walk all of the help desk users through setting up the query, although I figured having the ability to select your own time range would be useful.
1 2 3 4 5 6 7 8 9 10 11 12 13 14 15 16 17 18 19 20 21 22 23 24 25 26 27 28 29 30 31 32 33 34 35 36 37 38 39 40 41 42 43 44 45 46 47 48 49 50 51 52 53 54 55 56 57 58 59 60 61 62 63 64 65 66 | { title: User Logon Count // Define the data source data: { url: { // Which index to search index: firewall_logs* body: { _source: ['@timestamp', 'user', 'action']"query": { "bool": { "must": [{ "query_string": { "default_field": "subtype", "query": "user" } }, { "range": { "@timestamp": { "%timefilter%": true } } }] }} aggs: { time_buckets: { date_histogram: { field: @timestamp interval: {%autointerval%: true} extended_bounds: { // Use the current time range's start and end min: {%timefilter%: "min"} max: {%timefilter%: "max"} } // Use this for linear (e.g. line, area) graphs. Without it, empty buckets will not show up min_doc_count: 0 } } } size: 0 } } format: {property: "aggregations.time_buckets.buckets"} } mark: point encoding: { x: { field: key type: temporal axis: {title: false} // Don't add title to x-axis } y: { field: doc_count type: quantitative axis: {title: "Document count"} } }} |
