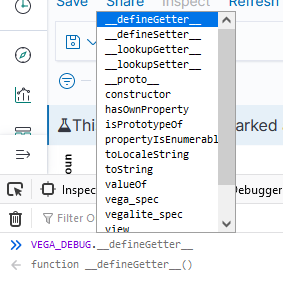
If you open the browser’s developer console, you can access debugging information. This works when you are editing a visualization as well as when you are viewing one. To see a list of available functions, type VEGA_DEBUG. and a drop-down will show you what’s available. The command “VEGA_DEBUG.vega_spec” outputs pretty much everything about the chart.

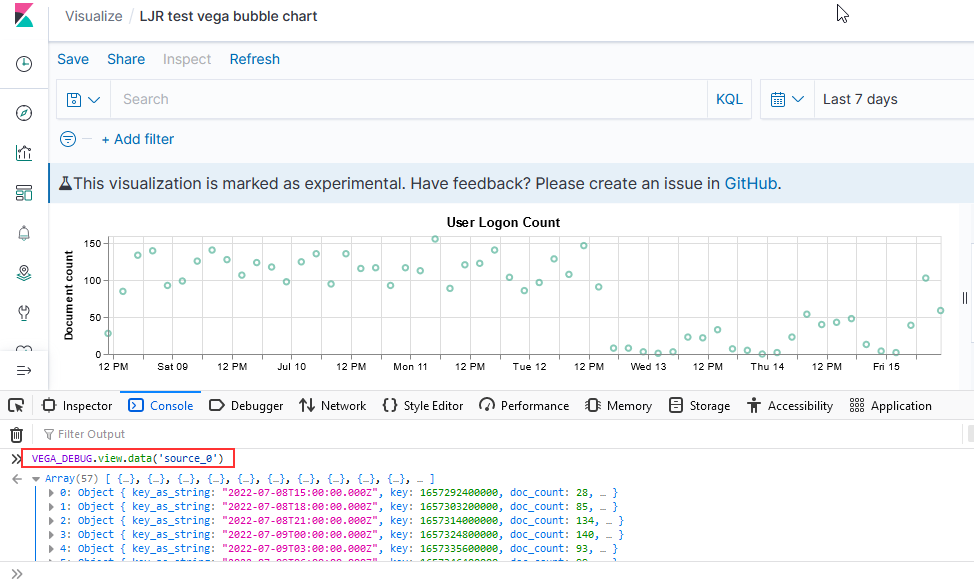
To access the data set being graphed with the Vega Lite grammar, use “VEGA_DEBUG.view.data(“source_0)” — if you are using the Vega grammar, use the dataset name that you have defined.
