There’s often a difference between hypothetical (e.g. the physics formula answer) and real results — sometimes this is because sciences will ignore “negligible” factors that can be, well, more than negligible, sometimes this is because the “real world” isn’t perfect. In transmission media, this difference is a measurable “loss” — hypothetically, we know we could send X data in Y delta-time, but we only sent X’. Loss also happens because stuff breaks — metal corrodes, critters nest in fiber junction boxes, dirt builds up on a dish. And it’s not easy, when looking at loss data at a single point in time, to identify what’s normal loss and what’s a problem.
We’re starting a project to record a baseline of loss for all sorts of things — this will allow individuals to check the current loss data against that which engineers say “this is as good as it’s gonna get”. If the current value is close … there’s not a problem. If there’s a big difference … someone needs to go fix something.
Unfortunately, creating a graph in Kibana that shows the baseline was … not trivial. There is a rule mark that allows you to draw a straight line between two points. You cannot just say “draw a line at y from 0 to some large value that’s going to be off the graph. The line doesn’t render (say, 0 => today or the year 2525). You cannot just get the max value of the axis.
I finally stumbled across a series of data contortions that make the baseline graphable.
The data sets I have available have a datetime object (when we measured this loss) and a loss value. For scans, there may be lots of scans for a single device. For baselines, there will only be one record.
The joinaggregate transformation method — which appends the value to each element of the data set — was essential because I needed to know the largest datetime value that would appear in the chart.
, {“type”: “joinaggregate”, “fields”: [“transformedtimestamp”], “ops”: [“max”], “as”: [“maxtime”]}
The lookup transformation method — which can access elements from other data sets — allowed me to get that maximum timestamp value into the baseline data set. Except … lookup needs an exact match in the search field. Luckily, it does return a random (I presume either first or last … but it didn’t matter in this case because all records have the same max date value) record when multiple matches are found.
So I used a formula transformation method to add a constant to each record as well
, {“type”: “formula”, “as”: “pi”, “expr”: “PI”}
Now that there’s a record to be found, I can add the max time from our scan data into our baseline data
, {“type”: “lookup”, “from”: “scandata”, “key”: “pi”, “fields”: [“pi”], “values”: [“maxtime”], “as”: [“maxtime”]}
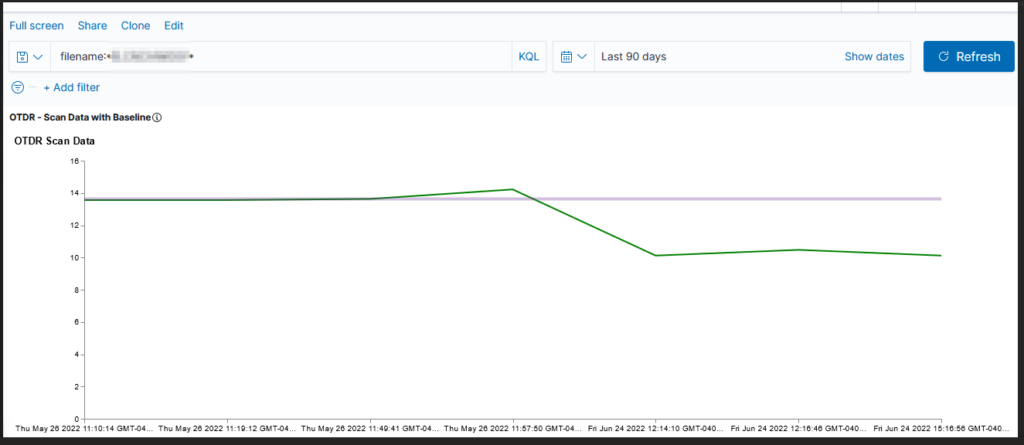
Voila — a chart with a horizontal line at the baseline loss value. Yes, I randomly copied a record to use as the baseline and selected the wrong one (why some scans are below the “good as it’s ever going to get” baseline value!). But … once we have live data coming into the system, we’ll have reasonable looking graphs.

The full Vega spec for this graph:
{
    "$schema": "https://vega.github.io/schema/vega/v4.json",
      "description": "Scan data with baseline",
    "padding": 5,

    "title": {
        "text": "Scan Data",
        "frame": "bounds",
        "anchor": "start",
        "offset": 12,
        "zindex": 0
      },
    "data": [
    {
        "name": "scandata",
        "url": {
            "%context%": true,
            "%timefield%": "@timestamp",
            "index": "traces-*",
            "body": {
            "sort": [{
                "@timestamp": {
                    "order": "asc"
                }
            }],
            "size": 10000,
            "_source":["@timestamp","Events.Summary.total loss"]
            }
        }
        ,"format": { "property": "hits.hits"}
        ,"transform":[
            {"type": "formula", "expr": "datetime(datum._source['@timestamp'])", "as": "transformedtimestamp"}
            , {"type": "joinaggregate", "fields": ["transformedtimestamp"], "ops": ["max"], "as": ["maxtime"]}
            , {"type": "formula", "as": "pi", "expr": "PI"}
        ]
    }
  ,
   {
        "name": "baseline",
        "url": {
            "%context%": true,
            "index": "baselines*",
            "body": {
                "sort": [{
                    "@timestamp": {
                        "order": "desc"
                    }
                }],
                "size": 1,
                "_source":["@timestamp","Events.Summary.total loss"]
            }
        }
        ,"format": { "property": "hits.hits" }
        ,"transform":[
                {"type": "formula", "as": "pi", "expr": "PI"}
                , {"type": "lookup", "from": "scandata", "key": "pi", "fields": ["pi"], "values": ["maxtime"], "as": ["maxtime"]}
        ]
  }
]
,
    "scales": [
      {
        "name": "x",
        "type": "point",
        "range": "width",
        "domain": {"data": "scandata", "field": "transformedtimestamp"}
      },
      {
        "name": "y",
        "type": "linear",
        "range": "height",
        "nice": true,
        "zero": true,
        "domain": {"data": "scandata", "field": "_source.Events.Summary.total loss"}
      }
    ],
        "axes": [
      {"orient": "bottom", "scale": "x"},
      {"orient": "left", "scale": "y"}
    ],
     "marks": [
                {
            "type": "line",
            "from": {"data": "scandata"},
            "encode": {
              "enter": {
                "x": { "scale": "x", "field": "transformedtimestamp", "type": "temporal",
      "timeUnit": "yearmonthdatehourminute"},
                "y": {"scale": "y",       "type": "quantitative","field": "_source.Events.Summary.total loss"},
                "strokeWidth": {"value": 2},
                "stroke": {"value": "green"}
              }
            }
          }
                 ,        {
            "type": "rule",
            "from": {"data": "baseline"},
            "encode": {
              "enter": {
                "stroke": {"value": "#652c90"},
                "x": {"scale": "x", "value": 0},
                "y": {"scale": "y",      "type": "quantitative","field": "_source.Events.Summary.total loss"},
                "x2": {"scale": "x","field": "maxtime", "type": "temporal"},
                "strokeWidth": {"value": 4},
                "opacity": {"value": 0.3}
              }
            }
          }
     ]
}